FRANCE The
FRANCE The
FRANCE The

Create successful ePaper yourself
Turn your PDF publications into a flip-book with our unique Google optimized e-Paper software.
Trends<br />
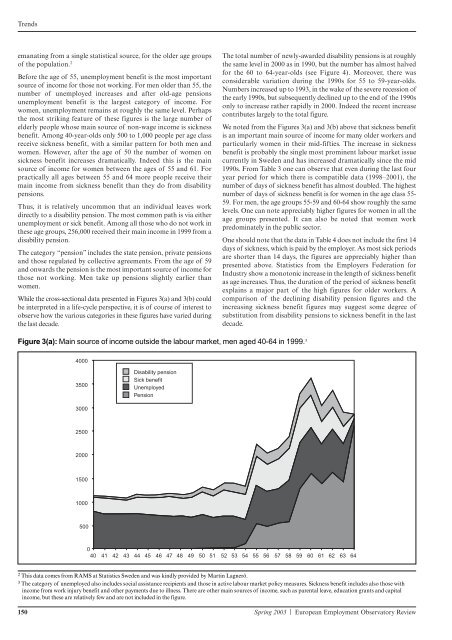
emanating from a single statistical source, for the older age groups<br />
of the population. 2<br />
Before the age of 55, unemployment benefit is the most important<br />
source of income for those not working. For men older than 55, the<br />
number of unemployed increases and after old-age pensions<br />
unemployment benefit is the largest category of income. For<br />
women, unemployment remains at roughly the same level. Perhaps<br />
the most striking feature of these figures is the large number of<br />
elderly people whose main source of non-wage income is sickness<br />
benefit. Among 40-year-olds only 500 to 1,000 people per age class<br />
receive sickness benefit, with a similar pattern for both men and<br />
women. However, after the age of 50 the number of women on<br />
sickness benefit increases dramatically. Indeed this is the main<br />
source of income for women between the ages of 55 and 61. For<br />
practically all ages between 55 and 64 more people receive their<br />
main income from sickness benefit than they do from disability<br />
pensions.<br />
Thus, it is relatively uncommon that an individual leaves work<br />
directly to a disability pension. <strong>The</strong> most common path is via either<br />
unemployment or sick benefit. Among all those who do not work in<br />
these age groups, 256,000 received their main income in 1999 from a<br />
disability pension.<br />
<strong>The</strong> category “pension” includes the state pension, private pensions<br />
and those regulated by collective agreements. From the age of 59<br />
and onwards the pension is the most important source of income for<br />
those not working. Men take up pensions slightly earlier than<br />
women.<br />
While the cross-sectional data presented in Figures 3(a) and 3(b) could<br />
be interpreted in a life-cycle perspective, it is of course of interest to<br />
observe how the various categories in these figures have varied during<br />
the last decade.<br />
Figure 3(a): Main source of income outside the labour market, men aged 40-64 in 1999. 3<br />
4000<br />
3500<br />
3000<br />
2500<br />
2000<br />
1500<br />
1000<br />
500<br />
Disability pension<br />
Sick benefit<br />
Unemployed<br />
Pension<br />
<strong>The</strong> total number of newly-awarded disability pensions is at roughly<br />
the same level in 2000 as in 1990, but the number has almost halved<br />
for the 60 to 64-year-olds (see Figure 4). Moreover, there was<br />
considerable variation during the 1990s for 55 to 59-year-olds.<br />
Numbers increased up to 1993, in the wake of the severe recession of<br />
the early 1990s, but subsequently declined up to the end of the 1990s<br />
only to increase rather rapidly in 2000. Indeed the recent increase<br />
contributes largely to the total figure.<br />
We noted from the Figures 3(a) and 3(b) above that sickness benefit<br />
is an important main source of income for many older workers and<br />
particularly women in their mid-fifties. <strong>The</strong> increase in sickness<br />
benefit is probably the single most prominent labour market issue<br />
currently in Sweden and has increased dramatically since the mid<br />
1990s. From Table 3 one can observe that even during the last four<br />
year period for which there is compatible data (1998–2001), the<br />
number of days of sickness benefit has almost doubled. <strong>The</strong> highest<br />
number of days of sickness benefit is for women in the age class 55-<br />
59. For men, the age groups 55-59 and 60-64 show roughly the same<br />
levels. One can note appreciably higher figures for women in all the<br />
age groups presented. It can also be noted that women work<br />
predominately in the public sector.<br />
One should note that the data in Table 4 does not include the first 14<br />
days of sickness, which is paid by the employer. As most sick periods<br />
are shorter than 14 days, the figures are appreciably higher than<br />
presented above. Statistics from the Employers Federation for<br />
Industry show a monotonic increase in the length of sickness benefit<br />
as age increases. Thus, the duration of the period of sickness benefit<br />
explains a major part of the high figures for older workers. A<br />
comparison of the declining disability pension figures and the<br />
increasing sickness benefit figures may suggest some degree of<br />
substitution from disability pensions to sickness benefit in the last<br />
decade.<br />
0<br />
40 41 42 43 44 45 46 47 48 49 50 51 52 53 54 55 56 57 58 59 60 61 62 63 64<br />
2 This data comes from RAMS at Statistics Sweden and was kindly provided by Martin Lagnerö.<br />
3 <strong>The</strong> category of unemployed also includes social assistance recipients and those in active labour market policy measures. Sickness benefit includes also those with<br />
income from work injury benefit and other payments due to illness. <strong>The</strong>re are other main sources of income, such as parental leave, education grants and capital<br />
income, but these are relatively few and are not included in the figure.<br />
150 Spring 2003 | European Employment Observatory Review