FRANCE The
FRANCE The
FRANCE The

You also want an ePaper? Increase the reach of your titles
YUMPU automatically turns print PDFs into web optimized ePapers that Google loves.
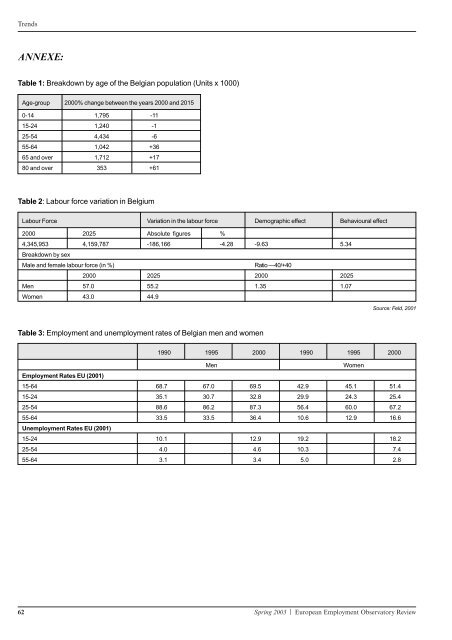
Trends<br />
ANNEXE:<br />
Table 1: Breakdown by age of the Belgian population (Units x 1000)<br />
Age-group 2000% change between the years 2000 and 2015<br />
0-14 1,795 -11<br />
15-24 1,240 -1<br />
25-54 4,434 -6<br />
55-64 1,042 +36<br />
65 and over 1,712 +17<br />
80 and over 353 +61<br />
Table 2: Labour force variation in Belgium<br />
Labour Force Variation in the labour force Demographic effect Behavioural effect<br />
2000 2025 Absolute figures %<br />
4,345,953 4,159,787 -186,166 -4.28 -9.63 5.34<br />
Breakdown by sex<br />
Male and female labour force (in %) Ratio —40/+40<br />
2000 2025 2000 2025<br />
Men 57.0 55.2 1.35 1.07<br />
Women 43.0 44.9<br />
Table 3: Employment and unemployment rates of Belgian men and women<br />
Employment Rates EU (2001)<br />
Source: Feld, 2001<br />
1990 1995 2000 1990 1995 2000<br />
Men Women<br />
15-64 68.7 67.0 69.5 42.9 45.1 51.4<br />
15-24 35.1 30.7 32.8 29.9 24.3 25.4<br />
25-54 88.6 86.2 87.3 56.4 60.0 67.2<br />
55-64 33.5 33.5 36.4 10.6 12.9 16.6<br />
Unemployment Rates EU (2001)<br />
15-24 10.1 12.9 19.2 18.2<br />
25-54 4.0 4.6 10.3 7.4<br />
55-64 3.1 3.4 5.0 2.8<br />
62 Spring 2003 | European Employment Observatory Review