Trends Table 6: <strong>The</strong> cost of ageing and other statistics Long-term projections of public pensions spending (EPC 2001) Level % increase Level % increase 2000 2020 2050 2000-50 2000 2020 250 2000-50 Old-age dependency ratio 2 25,5 32,7 45,0 76,0 24,2 32,2 49,0 100,0 Public pensions expenditure % of GDP 3 10,0 11,4 13,3 33,0 10,4 11,5 13,3 27,9 Factors determining the evolution of public pensions expenditure (2000-2050) 3 Democratic dependency 5,2 6,4 + Employment -0,9 -1,1 + Eligibility 0,9 0,6 + Level of benefits -2,0 -2,8 = Total (including residual) 3,3 3,1 ESSPROS Pensions expenditure 4 Contribution to change in percentage Contribution to change in percentage points of GDP points of GDP (1999) 11,6 12,7 Recent income situation (1999 ECHP data) Total Men Women Total Men Women 0-64 65+ 0-64 65+ 0-64 65+ 0-64 65+ 0-64 65+ 0-64 65+ At-risk-of-poverty rate 1 (at 50% of median) 6 12 5 11 7 12 11 12 10 9 12 13 At-risk-of-poverty rate 1 (at 60% of median) 11 22 10 20 13 22 17 20 17 17 18 22 Inequality of income distribution 1 4,1 4,3 5,1 4,5 Income of people aged 65+ as a ratio of income of people aged 0-64 0,76 0,77 0,76 0,88 0,92 0,86 1 Notes: 1. Source: ECHP-UDB, Eurostat, version December 2002. Data for the UK is provisional. <strong>The</strong> weights for the Spanish data will be revised. Data for Sweden only cover persons aged less that 85; see methodological note. 2. Source: EUROSTAT, demographic projections. Number of people aged 65 years and over as a percentage of people aged 15-64. 3. Source: Economic Policy Committee, Report on Budgetary challenges posed by ageing populations , 24 October 2001; see methodological note. Table 7: Educational attainments of the population aged 50-64 in Belgium, 2000 25-29 Source: European Commission, 2002a Men & Women Men Women Less than upper secondary 19.8 22.4 17.2 Upper secondary 42.5 43.6 41.3 Tertiary education 37.7 34.1 41.5 30-49 Less than upper secondary 37.2 39.7 34.7 Upper secondary 33.2 31.9 34.5 Tertiary education 29.6 28.4 30.8 50-64 Less than upper secondary 58.6 55.3 61.8 Upper secondary 23.0 24.5 21.5 Tertiary education 18.4 20.2 16.7 Source: Eurostat, 2002d 64 Spring 2003 | European Employment Observatory Review
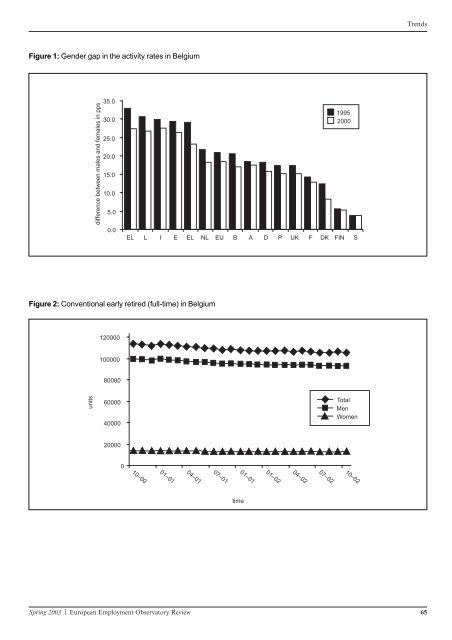
Figure 1: Gender gap in the activity rates in Belgium difference between males and females in pps 35.0 30.0 25.0 20.0 15.0 10.0 5.0 0.0 Figure 2: Conventional early retired (full-time) in Belgium units 120000 100000 80000 60000 40000 20000 0 EL L I E EL NL EU B A D P UK F DK FIN S 10–00 01–01 04–01 07–01 Spring 2003 | European Employment Observatory Review 65 time 01–01 01–02 04–02 07–02 1995 2000 Total Men Women 10–02 Trends
- Page 1 and 2:
Employment & European Social Fund E
- Page 3 and 4:
European Employment Observatory Rev
- Page 5 and 6:
Table of Contents Policies Overall
- Page 7 and 8:
AUSTRIA The programme of the Austri
- Page 9 and 10:
FINLAND Essential changes to legisl
- Page 11 and 12:
At least one quarter of the members
- Page 13 and 14: in the event of a third and subsequ
- Page 15 and 16: of active labour-market policy, as
- Page 17 and 18: Training Networks Programme The Tra
- Page 19 and 20: Subsequently, the provisions concer
- Page 21 and 22: a strengthening and revitalisation
- Page 23 and 24: workers into the labour market as w
- Page 25 and 26: This reinforced targeting and resul
- Page 27 and 28: BELGIUM The Occupational Immersion
- Page 29 and 30: Agreement on converting 10,000 subs
- Page 31 and 32: outplacement procedure, its duratio
- Page 33 and 34: Integration agreements Another impo
- Page 35 and 36: and local job and volunteering oppo
- Page 37 and 38: FINLAND Preliminary information on
- Page 39 and 40: BELGIUM Harmonisation and simplific
- Page 41 and 42: • Returning migrants Eligibility
- Page 43 and 44: Playing the generation game: an ove
- Page 45 and 46: workers, who have either exited the
- Page 47 and 48: e) Finland’s comprehensive approa
- Page 49 and 50: Compared with the figures for 1997,
- Page 51 and 52: Table 4: Activity quotas by age and
- Page 53 and 54: Table 6: Length of unemployment by
- Page 55 and 56: 4Prospects In view of the demograph
- Page 57 and 58: and is exempted from the obligation
- Page 59 and 60: The Government is also addressing t
- Page 61 and 62: permanente, 97-124 Desmet, R. and J
- Page 63: Table 4: Breakdown by age of older
- Page 67 and 68: Figure 5: Effective and statutory r
- Page 69 and 70: 3. Recent trends in policies As alr
- Page 71 and 72: 3.3 Labour market programmes for el
- Page 73 and 74: Figure 1: Population aged 15 and ov
- Page 75 and 76: Table 3: Labour market transition r
- Page 77 and 78: companies. One of these projects wa
- Page 79 and 80: Table 2: Projection of the economic
- Page 81 and 82: Table 8: Numbers entering Early Ret
- Page 83 and 84: Figure 1: Rate of access to trainin
- Page 85 and 86: Germany 1 Introduction As far back
- Page 87 and 88: Figure 3: Potentially economically
- Page 89 and 90: Figure 5: Take-up of early-retireme
- Page 91 and 92: Figure 8: Average amounts paid unde
- Page 93 and 94: 64.5% (Hain/Tautz 2001: 365) withou
- Page 95 and 96: Table 6: Collectively agreed workin
- Page 97 and 98: Strukturbruch und Arbeitsmark-tentw
- Page 99 and 100: men (Figure 3). In clear contrast w
- Page 101 and 102: Figure 5: Unemployment rates, males
- Page 103 and 104: More recent data, provided by Euros
- Page 105 and 106: pensions retracted to normal levels
- Page 107 and 108: Ireland 1. Introduction This Paper
- Page 109 and 110: Table 3: Labour force trends, 1991-
- Page 111 and 112: Table 4: Employment by age across s
- Page 113 and 114: Occupational pensions There are als
- Page 115 and 116:
Italy 1. Introduction The EU offici
- Page 117 and 118:
Table 7: Activity rates (age 55-64)
- Page 119 and 120:
Table 10: Forecasts of employment r
- Page 121 and 122:
should take the territorial imbalan
- Page 123 and 124:
2. Statistical Data 5 Number of pen
- Page 125 and 126:
4.2 Measures to encourage older wor
- Page 127 and 128:
6. Conclusions With regard to keepi
- Page 129 and 130:
level. No taxes and social premiums
- Page 131 and 132:
edundancy scheme by employers. The
- Page 133 and 134:
uittreding: early retirement) schem
- Page 135 and 136:
Figure 4: Dependency and ageing ind
- Page 137 and 138:
Figure 8: Percentage of working age
- Page 139 and 140:
Figure 11: Average age of workers l
- Page 141 and 142:
Figure 2: percentage change between
- Page 143 and 144:
Figure 4: Figure 5: 25 20 15 10 0 -
- Page 145 and 146:
100 90 80 70 60 50 40 30 20 10 Figu
- Page 147 and 148:
However, this measure does not cove
- Page 149 and 150:
Table 1(a): Employment rate, men, 5
- Page 151 and 152:
Figure 3(b): Main Source of income
- Page 153 and 154:
4. Policies to stimulate active age
- Page 155 and 156:
Appendix Table A1(a): Participation
- Page 157 and 158:
Venta • Salg • Verkauf • Pvl