FRANCE The
FRANCE The
FRANCE The

Create successful ePaper yourself
Turn your PDF publications into a flip-book with our unique Google optimized e-Paper software.
Trends<br />
According to the estimates, in order to reach the 2010 employment<br />
rate target at EU level, Spain needs to increase its employment rate to<br />
at least 68.5% by 2010. <strong>The</strong> main driver behind the success of a<br />
strategy to achieve this target lies mainly in increasing female<br />
employment rates. <strong>The</strong> projected female employment rate for year<br />
2010 in Spain is 58.9%, although the underlying assumptions,<br />
particularly in relation to GDP growth12 , seem very optimistic. <strong>The</strong><br />
achievement of this ratio implies an annual average female<br />
employment growth of 3.8%, which is also very challenging.<br />
Finally, concerning employment among older workers, the most<br />
optimistic projections in Spain foresee an average annual growth of<br />
4.8% up to 2010. Still, this would not be enough at EU level to reach<br />
the 50% target. This highlights the need for significant reforms if the<br />
Stockholm target is to be reached, as the growth rates required are<br />
again very challenging.<br />
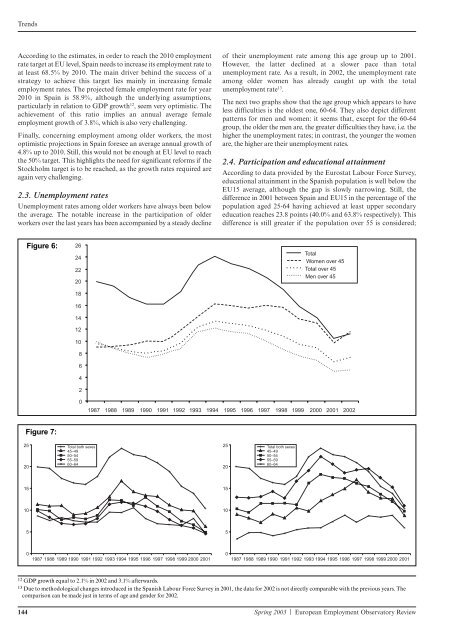
2.3. Unemployment rates<br />
Unemployment rates among older workers have always been below<br />
the average. <strong>The</strong> notable increase in the participation of older<br />
workers over the last years has been accompanied by a steady decline<br />
Figure 6:<br />
Figure 7:<br />
25<br />
20<br />
15<br />
10<br />
5<br />
+<br />
+<br />
+<br />
+<br />
+<br />
+<br />
+<br />
+<br />
26<br />
24<br />
22<br />
20<br />
18<br />
16<br />
14<br />
12<br />
10<br />
8<br />
6<br />
4<br />
2<br />
0<br />
Total both sexes<br />
45–49<br />
50–54<br />
55–59<br />
60–64<br />
+<br />
+ +<br />
+<br />
of their unemployment rate among this age group up to 2001.<br />
However, the latter declined at a slower pace than total<br />
unemployment rate. As a result, in 2002, the unemployment rate<br />
among older women has already caught up with the total<br />
unemployment rate13 .<br />
<strong>The</strong> next two graphs show that the age group which appears to have<br />
less difficulties is the oldest one, 60-64. <strong>The</strong>y also depict different<br />
patterns for men and women: it seems that, except for the 60-64<br />
group, the older the men are, the greater difficulties they have, i.e. the<br />
higher the unemployment rates; in contrast, the younger the women<br />
are, the higher are their unemployment rates.<br />
2.4. Participation and educational attainment<br />
According to data provided by the Eurostat Labour Force Survey,<br />
educational attainment in the Spanish population is well below the<br />
EU15 average, although the gap is slowly narrowing. Still, the<br />
difference in 2001 between Spain and EU15 in the percentage of the<br />
population aged 25-64 having achieved at least upper secondary<br />
education reaches 23.8 points (40.0% and 63.8% respectively). This<br />
difference is still greater if the population over 55 is considered;<br />
Total<br />
Women over 45<br />
Total over 45<br />
Men over 45<br />
1987 1988 1989 1990 1991 1992 1993 1994 1995 1996 1997 1998 1999 2000 2001 2002<br />
+<br />
+<br />
+ +<br />
0<br />
1987 1988 1989 1990 1991 1992 1993 1994 1995 1996 1997 1998 1999 2000 2001<br />
+<br />
+<br />
+<br />
+<br />
+<br />
+<br />
+<br />
+<br />
+<br />
+<br />
+<br />
+<br />
+<br />
+<br />
+<br />
+<br />
0<br />
1987 1988 1989 1990 1991 1992 1993 1994 1995 1996 1997 1998 1999 2000 2001<br />
144 Spring 2003 | European Employment Observatory Review<br />
25<br />
20<br />
15<br />
10<br />
5<br />
+<br />
+<br />
+<br />
+<br />
+<br />
+<br />
Total both sexes<br />
45–49<br />
50–54<br />
55–59<br />
60–64<br />
12 GDP growth equal to 2.1% in 2002 and 3.1% afterwards.<br />
13 Due to methodological changes introduced in the Spanish Labour Force Survey in 2001, the data for 2002 is not directly comparable with the previous years. <strong>The</strong><br />
comparison can be made just in terms of age and gender for 2002.<br />
+<br />
+<br />
+<br />
+<br />
+<br />
+<br />
+<br />
+<br />
+<br />
+<br />
+<br />
+<br />
+<br />
+<br />
+<br />
+<br />
+<br />
+<br />
+<br />
+<br />
+<br />
+<br />
+<br />
+<br />
+<br />
+