FRANCE The
FRANCE The
FRANCE The

You also want an ePaper? Increase the reach of your titles
YUMPU automatically turns print PDFs into web optimized ePapers that Google loves.
Trends<br />
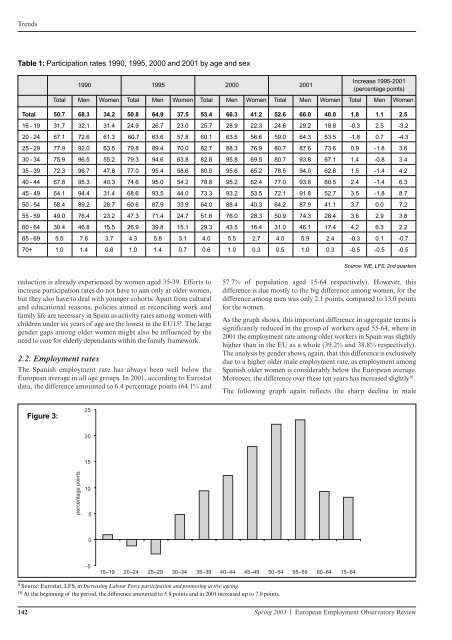
Table 1: Participation rates 1990, 1995, 2000 and 2001 by age and sex<br />
1990 1995 2000 2001<br />
Increase 1995-2001<br />
(percentage points)<br />
Total Men Women Total Men Women Total Men Women Total Men Women Total Men Women<br />
Total 50.7 68.3 34.2 50.8 64.9 37.5 53.4 66.3 41.2 52.6 66.0 40.0 1.8 1.1 2.5<br />
16 - 19 31.7 32.1 31.4 24.9 26.7 23.0 25.7 28.9 22.3 24.6 29.2 19.8 -0.3 2.5 -3.2<br />
20 - 24 67.1 72.6 61.3 60.7 63.6 57.8 60.1 63.5 56.6 59.0 64.3 53.5 -1.8 0.7 -4.3<br />
25 - 29 77.9 92.0 63.5 79.8 89.4 70.0 82.7 88.3 76.9 80.7 87.6 73.6 0.9 -1.8 3.6<br />
30 - 34 75.9 96.5 55.2 79.3 94.6 63.8 82.8 95.8 69.5 80.7 93.8 67.1 1.4 -0.8 3.4<br />
35 - 39 72.3 96.7 47.8 77.0 95.4 58.6 80.5 95.6 65.2 78.5 94.0 62.8 1.5 -1.4 4.2<br />
40 - 44 67.8 95.3 40.3 74.6 95.0 54.2 78.8 95.2 62.4 77.0 93.6 60.5 2.4 -1.4 6.3<br />
45 - 49 64.1 94.4 31.4 68.6 93.5 44.0 73.3 93.2 53.5 72.1 91.8 52.7 3.5 -1.8 8.7<br />
50 - 54 58.4 89.2 28.7 60.6 87.9 33.9 64.0 88.4 40.3 64.2 87.9 41.1 3.7 0.0 7.2<br />
55 - 59 49.0 76.4 23.2 47.3 71.4 24.7 51.6 76.0 28.3 50.9 74.3 28.4 3.6 2.9 3.8<br />
60 - 64 30.4 46.8 15.5 26.9 39.8 15.1 29.3 43.5 16.4 31.0 46.1 17.4 4.2 6.3 2.2<br />
65 - 69 5.5 7.6 3.7 4.3 5.8 3.1 4.0 5.5 2.7 4.0 5.9 2.4 -0.3 0.1 -0.7<br />
70+ 1.0 1.4 0.8 1.0 1.4 0.7 0.6 1.0 0.3 0.5 1.0 0.3 -0.5 -0.5 -0.5<br />
reduction is already experienced by women aged 35-39. Efforts to<br />
increase participation rates do not have to aim only at older women,<br />
but they also have to deal with younger cohorts. Apart from cultural<br />
and educational reasons, policies aimed at reconciling work and<br />
family life are necessary in Spain as activity rates among women with<br />
children under six years of age are the lowest in the EU15 9 . <strong>The</strong> large<br />
gender gaps among older women might also be influenced by the<br />
need to care for elderly dependants within the family framework.<br />
2.2. Employment rates<br />
<strong>The</strong> Spanish employment rate has always been well below the<br />
European average in all age groups. In 2001, according to Eurostat<br />
data, the difference amounted to 6.4 percentage points (64.1% and<br />
Figure 3:<br />
percentage points<br />
25<br />
20<br />
15<br />
10<br />
5<br />
0<br />
–5<br />
Source: INE, LFS, 2nd quarters<br />
57.7% of population aged 15-64 respectively). However, this<br />
difference is due mostly to the big difference among women, for the<br />
difference among men was only 2.1 points, compared to 13.0 points<br />
for the women.<br />
As the graph shows, this important difference in aggregate terms is<br />
significantly reduced in the group of workers aged 55-64, where in<br />
2001 the employment rate among older workers in Spain was slightly<br />
higher than in the EU as a whole (39.2% and 38.8% respectively).<br />
<strong>The</strong> analysis by gender shows, again, that this difference is exclusively<br />
due to a higher older male employment rate, as employment among<br />
Spanish older women is considerably below the European average.<br />
Moreover, the difference over these ten years has increased slightly10 .<br />
<strong>The</strong> following graph again reflects the sharp decline in male<br />
15–19 20–24 25–29 30–34 35–39 40–44 45–49 50–54 55–59 60–64 15–64<br />
9 Source: Eurostat, LFS, in Increasing Labour Force participation and promoting active ageing.<br />
10 At the beginning of the period, the difference amounted to 5.8 points and in 2001 increased up to 7.0 points.<br />
142 Spring 2003 | European Employment Observatory Review