FRANCE The
FRANCE The
FRANCE The

You also want an ePaper? Increase the reach of your titles
YUMPU automatically turns print PDFs into web optimized ePapers that Google loves.
Trends<br />
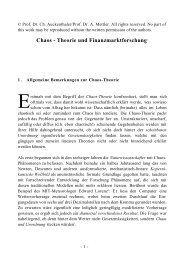
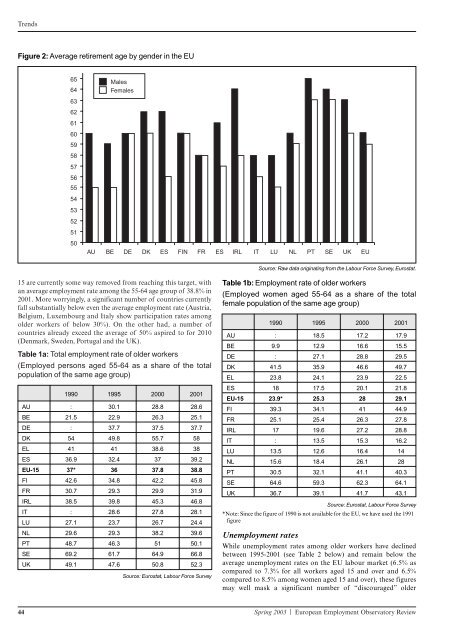
Figure 2: Average retirement age by gender in the EU<br />
65<br />
64<br />
63<br />
62<br />
61<br />
60<br />
59<br />
58<br />
57<br />
56<br />
55<br />
54<br />
53<br />
52<br />
51<br />
50<br />
Males<br />
Females<br />
AU BE DE DK ES FIN FR ES IRL IT LU NL PT SE UK EU<br />
15 are currently some way removed from reaching this target, with<br />
an average employment rate among the 55-64 age group of 38.8% in<br />
2001. More worryingly, a significant number of countries currently<br />
fall substantially below even the average employment rate (Austria,<br />
Belgium, Luxembourg and Italy show participation rates among<br />
older workers of below 30%). On the other had, a number of<br />
countries already exceed the average of 50% aspired to for 2010<br />
(Denmark, Sweden, Portugal and the UK).<br />
Table 1a: Total employment rate of older workers<br />
(Employed persons aged 55-64 as a share of the total<br />
population of the same age group)<br />
1990 1995 2000 2001<br />
AU : 30.1 28.8 28.6<br />
BE 21.5 22.9 26.3 25.1<br />
DE : 37.7 37.5 37.7<br />
DK 54 49.8 55.7 58<br />
EL 41 41 38.6 38<br />
ES 36.9 32.4 37 39.2<br />
EU-15 37* 36 37.8 38.8<br />
FI 42.6 34.8 42.2 45.8<br />
FR 30.7 29.3 29.9 31.9<br />
IRL 38.5 39.8 45.3 46.8<br />
IT : 28.6 27.8 28.1<br />
LU 27.1 23.7 26.7 24.4<br />
NL 29.6 29.3 38.2 39.6<br />
PT 48.7 46.3 51 50.1<br />
SE 69.2 61.7 64.9 66.8<br />
UK 49.1 47.6 50.8 52.3<br />
Source: Eurostat, Labour Force Survey<br />
Source: Raw data originating from the Labour Force Survey, Eurostat.<br />
Table 1b: Employment rate of older workers<br />
(Employed women aged 55-64 as a share of the total<br />
female population of the same age group)<br />
1990 1995 2000 2001<br />
AU : 18.5 17.2 17.9<br />
BE 9.9 12.9 16.6 15.5<br />
DE : 27.1 28.8 29.5<br />
DK 41.5 35.9 46.6 49.7<br />
EL 23.8 24.1 23.9 22.5<br />
ES 18 17.5 20.1 21.8<br />
EU-15 23.9* 25.3 28 29.1<br />
FI 39.3 34.1 41 44.9<br />
FR 25.1 25.4 26.3 27.8<br />
IRL 17 19.6 27.2 28.8<br />
IT : 13.5 15.3 16.2<br />
LU 13.5 12.6 16.4 14<br />
NL 15.6 18.4 26.1 28<br />
PT 30.5 32.1 41.1 40.3<br />
SE 64.6 59.3 62.3 64.1<br />
UK 36.7 39.1 41.7 43.1<br />
Source: Eurostat, Labour Force Survey<br />
*Note: Since the figure of 1990 is not available for the EU, we have used the 1991<br />
figure<br />
Unemployment rates<br />
While unemployment rates among older workers have declined<br />
between 1995-2001 (see Table 2 below) and remain below the<br />
average unemployment rates on the EU labour market (6.5% as<br />
compared to 7.3% for all workers aged 15 and over and 6.5%<br />
compared to 8.5% among women aged 15 and over), these figures<br />
may well mask a significant number of “discouraged” older<br />
44 Spring 2003 | European Employment Observatory Review