Uganda Atlas of Our Changing Environment - GRID-Arendal
Uganda Atlas of Our Changing Environment - GRID-Arendal
Uganda Atlas of Our Changing Environment - GRID-Arendal

Create successful ePaper yourself
Turn your PDF publications into a flip-book with our unique Google optimized e-Paper software.
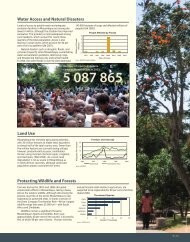
Literacy rate<br />
Literacy rates as a measure <strong>of</strong> social<br />
performance indicate that the central<br />
region is doing much better than<br />
the other regions <strong>of</strong> the country.<br />
Opportunities for employment,<br />
better education and health care<br />
in the region have encouraged in<br />
migration contributing to the growing<br />
human population in the region.<br />
This growth in numbers is putting<br />
immense pressure on the environment<br />
to provide resources for the growing<br />
population.<br />
Literacy rate<br />
Region Male Female Average<br />
Central 18.8 24.8 21.9<br />
Eastern 9.6 15.9 12.8<br />
Northern 33.8 37.1 35.5<br />
Western 11.5 13.2 12.4<br />
<strong>Uganda</strong> 21.9 17.9 19.7<br />
Source: UBOS Survey 2008<br />
166<br />
Literacy rates for the population aged 10 and above<br />
Literacy rate (%)<br />
Central Eastern Northern Western <strong>Uganda</strong><br />
Source: UBOS-UNHS 2005/06<br />
Region<br />
1999/2000 2002/2003 2005/2006<br />
Region 1999/2000 2002/2003 2005/2006<br />
Central 77 79 80<br />
Eastern 62 63 64<br />
Northern 47 56 59<br />
Western 67 74 67<br />
<strong>Uganda</strong> 65 70 69<br />
Source: UBOS-UNHS 2005/06<br />
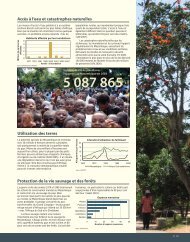
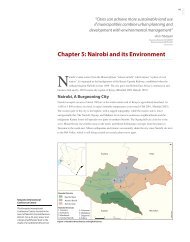
Pupils <strong>of</strong> Jjanyi Primary School in Wakiso District. NEMA visited the rural UPE (Universal<br />
Primary Education) school during the Schools ESD (Education for Sustainable Development)<br />
planning activities in February 2009.<br />
NEMA 2009