Gulf and European Energy Supply Security - Feem-project.net
Gulf and European Energy Supply Security - Feem-project.net
Gulf and European Energy Supply Security - Feem-project.net

You also want an ePaper? Increase the reach of your titles
YUMPU automatically turns print PDFs into web optimized ePapers that Google loves.
case. Figure 8 shows the development of RES-H on<br />
technology level.<br />
Figure 9, shows the development of the<br />
renewable transport sector according to the<br />
strengthened national policy scenario. Traditional<br />
biofuel generation triples beyond 2010 from 3 Mtoe as<br />
of 2006 to 9 Mtoe by 2030. Additional contribution is<br />
expected from advanced biofuel generation (second<br />
generation – Fischer Tropsch, etc.) beyond 2015 going<br />
up to 10 Mtoe in 2030. Generally, traditional biofuel<br />
generation equals the amount under the Business<br />
as Usual scenario whereas still high exploitable<br />
potentials are considered in the advanced biofuel<br />
technologies. However, substantial increases are<br />
still considered in the biofuel import from abroad<br />
which amounts to 15 Mtoe in 2030. Consequently, as<br />
shown in Table 2, the strengthened national policy<br />
scenario does meet both the 20 percent RES by 2020<br />
target <strong>and</strong> the 10 percent biofuel by 2020 target; the<br />
latter refers to 10 percent biofuel on solely diesel <strong>and</strong><br />
gasoline dem<strong>and</strong>.<br />
Given the uneven distribution of RES potentials<br />
within the <strong>European</strong> Union, member states are<br />
entitled to install flexibility mechanisms in order to<br />
exploit their RES potentials in a least-cost approach.<br />
Generally, also in this scenario, the electricity sector<br />
is still the strongest contributor of renewable energy,<br />
but the heat sector takes up strongly.<br />
2.1.3 Global Regime (Full trade) –<br />
strengthened national Policy:<br />
Principally, the Global Regime (Full Trade)<br />
scenario implies a strong emphasis on climate<br />
change issues on not only the <strong>European</strong> level but<br />
on global scale. Hence, energy dem<strong>and</strong> growth<br />
forecasts are relatively low, but for Europe higher<br />
than the Europe Alone scenario, since it is not<br />
expected that the industry will strongly shift abroad.<br />
Overview of RES Characteristics <strong>and</strong> Future Scenarios<br />
Caused by the low energy dem<strong>and</strong> on global scale,<br />
raw energy prices are low <strong>and</strong> CO2 prices are not<br />
as high as in the Europe Alone scenario, due to<br />
the global trade opportunity. However, renewable<br />
energy support measures are strengthened with<br />
respect to effectiveness <strong>and</strong> efficiency in order<br />
to pursue the 20 percent RES by 2020 target. The<br />
<strong>project</strong>ed sectoral contribution in relative terms – i.e.<br />
by indicating the deployment of RES-E, RES-H <strong>and</strong><br />
RES-T as shares of corresponding gross dem<strong>and</strong>s is<br />
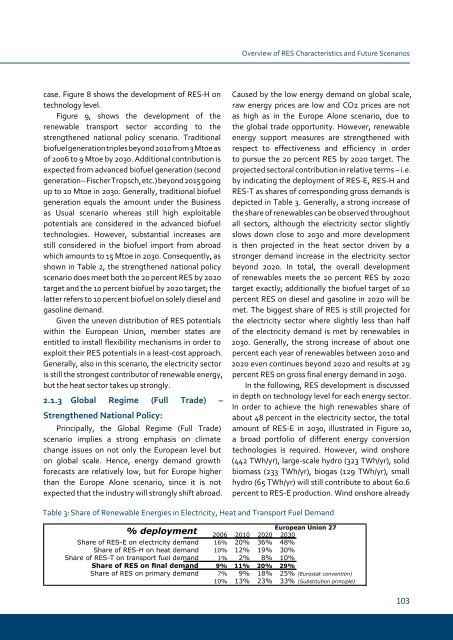
depicted in Table 3. Generally, a strong increase of<br />
the share of renewables can be observed throughout<br />
all sectors, although the electricity sector slightly<br />
slows down close to 2030 <strong>and</strong> more development<br />
is then <strong>project</strong>ed in the heat sector driven by a<br />
stronger dem<strong>and</strong> increase in the electricity sector<br />
beyond 2020. In total, the overall development<br />
of renewables meets the 20 percent RES by 2020<br />
target exactly; additionally the biofuel target of 10<br />
percent RES on diesel <strong>and</strong> gasoline in 2020 will be<br />
met. The biggest share of RES is still <strong>project</strong>ed for<br />
the electricity sector where slightly less than half<br />
of the electricity dem<strong>and</strong> is met by renewables in<br />
2030. Generally, the strong increase of about one<br />
percent each year of renewables between 2010 <strong>and</strong><br />
2020 even continues beyond 2020 <strong>and</strong> results at 29<br />
percent RES on gross final energy dem<strong>and</strong> in 2030.<br />
In the following, RES development is discussed<br />
in depth on technology level for each energy sector.<br />
In order to achieve the high renewables share of<br />
about 48 percent in the electricity sector, the total<br />
amount of RES-E in 2030, illustrated in Figure 10,<br />
a broad portfolio of different energy conversion<br />
technologies is required. However, wind onshore<br />
(442 TWh/yr), large-scale hydro (323 TWh/yr), solid<br />
biomass (233 TWh/yr), biogas (129 TWh/yr), small<br />
hydro (65 TWh/yr) will still contribute to about 60.6<br />
percent to RES-E production. Wind onshore already<br />
Table 3: Share of Renewable Energies in Electricity, Heat <strong>and</strong> Transport Fuel Dem<strong>and</strong><br />
% deployment 2006 2010<br />
<strong>European</strong> Union 27<br />
2020 2030<br />
Share of RES-E on electricity dem<strong>and</strong> 16% 20% 36% 48%<br />
Share of RES-H on heat dem<strong>and</strong> 10% 12% 19% 30%<br />
Share of RES-T on transport fuel dem<strong>and</strong> 1% 2% 8% 10%<br />
Share of RES on final dem<strong>and</strong> 9% 11% 20% 29%<br />
Share of RES on primary dem<strong>and</strong> 7% 9% 18% 25% (Eurostat convention)<br />
10% 13% 23% 33% (Substitution principle)<br />
10