Gulf and European Energy Supply Security - Feem-project.net
Gulf and European Energy Supply Security - Feem-project.net
Gulf and European Energy Supply Security - Feem-project.net

You also want an ePaper? Increase the reach of your titles
YUMPU automatically turns print PDFs into web optimized ePapers that Google loves.
<strong>Energy</strong> <strong>Security</strong>: Potential for EU-GCC Cooperation<br />
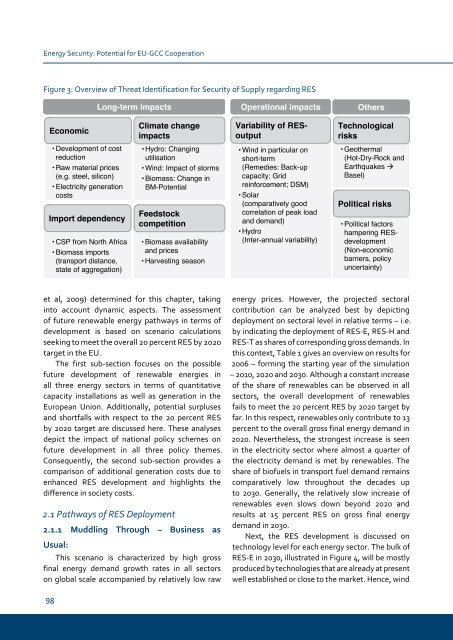
Figure 3: Overview of Threat Identification for <strong>Security</strong> of <strong>Supply</strong> regarding RES<br />
Economic<br />
• Development of cost<br />
reduction<br />
• Raw material prices<br />
(e.g. steel, silicon)<br />
• Electricity generation<br />
costs<br />
Import dependency<br />
• CSP from North Africa<br />
• Biomass imports<br />
(transport distance,<br />
state of aggregation)<br />
et al, 2009) determined for this chapter, taking<br />
into account dynamic aspects. The assessment<br />
of future renewable energy pathways in terms of<br />
development is based on scenario calculations<br />
seeking to meet the overall 20 percent RES by 2020<br />
target in the EU.<br />
The first sub-section focuses on the possible<br />
future development of renewable energies in<br />
all three energy sectors in terms of quantitative<br />
capacity installations as well as generation in the<br />
<strong>European</strong> Union. Additionally, potential surpluses<br />
<strong>and</strong> shortfalls with respect to the 20 percent RES<br />
by 2020 target are discussed here. These analyses<br />
depict the impact of national policy schemes on<br />
future development in all three policy themes.<br />
Consequently, the second sub-section provides a<br />
comparison of additional generation costs due to<br />
enhanced RES development <strong>and</strong> highlights the<br />
difference in society costs.<br />
2.1 Pathways of RES Deployment<br />
2.1.1 Muddling through – Business as<br />
Usual:<br />
Long-term impacts Operational impacts<br />
Climate change<br />
impacts<br />
• Hydro: Changing<br />
utilisation<br />
• Wind: Impact of storms<br />
• Biomass: Change in<br />
BM-Potential<br />
Feedstock<br />
competition<br />
• Biomass availability<br />
<strong>and</strong> prices<br />
• Harvesting season<br />
This scenario is characterized by high gross<br />
final energy dem<strong>and</strong> growth rates in all sectors<br />
on global scale accompanied by relatively low raw<br />
Variability of RESoutput<br />
• Wind in particular on<br />
short-term<br />
(Remedies: Back-up<br />
capacity; Grid<br />
reinforcement; DSM)<br />
• Solar<br />
(comparatively good<br />
correlation of peak load<br />
<strong>and</strong> dem<strong>and</strong>)<br />
• Hydro<br />
(Inter-annual variability)<br />
Others<br />
Technological<br />
risks<br />
• Geothermal<br />
(Hot-Dry-Rock <strong>and</strong><br />
Earthquakes<br />
Basel)<br />
Political risks<br />
• Political factors<br />
hampering RESdevelopment<br />
(Non-economic<br />
barriers, policy<br />
uncertainty)<br />
energy prices. However, the <strong>project</strong>ed sectoral<br />
contribution can be analyzed best by depicting<br />
deployment on sectoral level in relative terms – i.e.<br />
by indicating the deployment of RES-E, RES-H <strong>and</strong><br />
RES-T as shares of corresponding gross dem<strong>and</strong>s. In<br />
this context, Table 1 gives an overview on results for<br />
2006 – forming the starting year of the simulation<br />
– 2010, 2020 <strong>and</strong> 2030. Although a constant increase<br />
of the share of renewables can be observed in all<br />
sectors, the overall development of renewables<br />
fails to meet the 20 percent RES by 2020 target by<br />
far. In this respect, renewables only contribute to 13<br />
percent to the overall gross final energy dem<strong>and</strong> in<br />
2020. Nevertheless, the strongest increase is seen<br />
in the electricity sector where almost a quarter of<br />
the electricity dem<strong>and</strong> is met by renewables. The<br />
share of biofuels in transport fuel dem<strong>and</strong> remains<br />
comparatively low throughout the decades up<br />
to 2030. Generally, the relatively slow increase of<br />
renewables even slows down beyond 2020 <strong>and</strong><br />
results at 15 percent RES on gross final energy<br />
dem<strong>and</strong> in 2030.<br />
Next, the RES development is discussed on<br />
technology level for each energy sector. The bulk of<br />
RES-E in 2030, illustrated in Figure 4, will be mostly<br />
produced by technologies that are already at present<br />
well established or close to the market. Hence, wind