Gulf and European Energy Supply Security - Feem-project.net
Gulf and European Energy Supply Security - Feem-project.net
Gulf and European Energy Supply Security - Feem-project.net

You also want an ePaper? Increase the reach of your titles
YUMPU automatically turns print PDFs into web optimized ePapers that Google loves.
<strong>Energy</strong> <strong>Security</strong>: Potential for EU-GCC Cooperation<br />
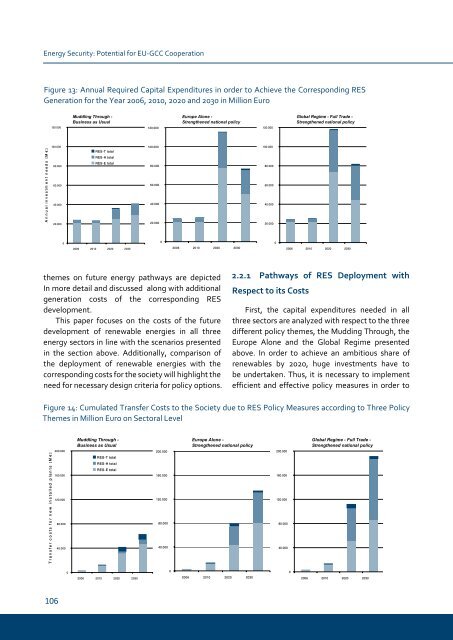
Figure 13: Annual Required Capital Expenditures in order to Achieve the Corresponding RES<br />
Generation for the Year 2006, 2010, 2020 <strong>and</strong> 2030 in Million Euro<br />
]<br />
€<br />
M<br />
[<br />
s<br />
d<br />
e<br />
e<br />
n<br />
t<br />
n<br />
e<br />
m<br />
t<br />
s<br />
e<br />
v<br />
n<br />
i<br />
l<br />
a<br />
u<br />
n<br />
n<br />
A<br />
themes on future energy pathways are depicted<br />
In more detail <strong>and</strong> discussed along with additional<br />
generation costs of the corresponding RES<br />
development.<br />
This paper focuses on the costs of the future<br />
development of renewable energies in all three<br />
energy sectors in line with the scenarios presented<br />
in the section above. Additionally, comparison of<br />
the deployment of renewable energies with the<br />
corresponding costs for the society will highlight the<br />
need for necessary design criteria for policy options.<br />
]<br />
€<br />
M<br />
[<br />
s<br />
t<br />
n<br />
a<br />
l<br />
p<br />
d<br />
e<br />
l<br />
l<br />
a<br />
t<br />
s<br />
n<br />
i<br />
w<br />
e<br />
n<br />
r<br />
o<br />
f<br />
s<br />
t<br />
s<br />
o<br />
c<br />
r<br />
e<br />
f<br />
s<br />
n<br />
a<br />
r<br />
T<br />
10<br />
120.000<br />
100.000<br />
80.000<br />
60.000<br />
40.000<br />
20.000<br />
0<br />
200.000<br />
160.000<br />
120.000<br />
80.000<br />
40.000<br />
0<br />
Muddling Through -<br />
Business as Usual<br />
RES-T total<br />
RES-H total<br />
RES-E total<br />
2006 2010 2020 2030<br />
RES-T total<br />
RES-H total<br />
RES-E total<br />
2006 2010 2020 2030<br />
120.000<br />
100.000<br />
80.000<br />
60.000<br />
40.000<br />
20.000<br />
0<br />
200.000<br />
160.000<br />
120.000<br />
80.000<br />
40.000<br />
0<br />
Europe Alone -<br />
Strengthened national policy<br />
2006 2010 2020 2030<br />
2006 2010 2020 2030<br />
120.000<br />
100.000<br />
80.000<br />
60.000<br />
40.000<br />
20.000<br />
2.2.1 Pathways of Res Deployment with<br />
Respect to its Costs<br />
0<br />
Global Regime - Full Trade -<br />
Strengthened national policy<br />
2006 2010 2020 2030<br />
First, the capital expenditures needed in all<br />
three sectors are analyzed with respect to the three<br />
different policy themes, the Mudding Through, the<br />
Europe Alone <strong>and</strong> the Global Regime presented<br />
above. In order to achieve an ambitious share of<br />
renewables by 2020, huge investments have to<br />
be undertaken. Thus, it is necessary to implement<br />
efficient <strong>and</strong> effective policy measures in order to<br />
Figure 14: Cumulated Transfer Costs to the Society due to RES Policy Measures according to Three Policy<br />
Themes in Million Euro on Sectoral Level<br />
Muddling Through -<br />
Business as Usual<br />
Europe Alone -<br />
Strengthened national policy<br />
200.000<br />
160.000<br />
120.000<br />
80.000<br />
40.000<br />
0<br />
Global Regime - Full Trade -<br />
Strengthened national policy<br />
2006 2010 2020 2030