Gulf and European Energy Supply Security - Feem-project.net
Gulf and European Energy Supply Security - Feem-project.net
Gulf and European Energy Supply Security - Feem-project.net

Create successful ePaper yourself
Turn your PDF publications into a flip-book with our unique Google optimized e-Paper software.
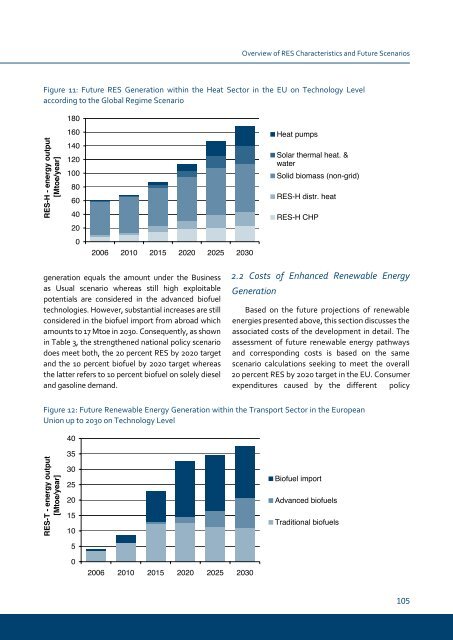
Overview of RES Characteristics <strong>and</strong> Future Scenarios<br />
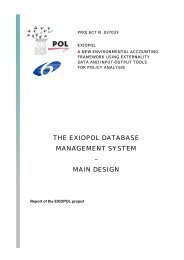
Figure 11: Future RES Generation within the Heat Sector in the EU on Technology Level<br />
according to the Global Regime Scenario<br />
t<br />
u<br />
p<br />
t<br />
u<br />
o<br />
y<br />
g<br />
r<br />
e<br />
n<br />
e<br />
-<br />
H<br />
-<br />
S<br />
E<br />
R<br />
]<br />
r<br />
a<br />
e<br />
y<br />
/<br />
e<br />
o<br />
t<br />
M<br />
[<br />
180<br />
160<br />
140<br />
120<br />
100<br />
80<br />
60<br />
40<br />
20<br />
0<br />
2006 2010 2015 2020 2025 2030<br />
generation equals the amount under the Business<br />
as Usual scenario whereas still high exploitable<br />
potentials are considered in the advanced biofuel<br />
technologies. However, substantial increases are still<br />
considered in the biofuel import from abroad which<br />
amounts to 17 Mtoe in 2030. Consequently, as shown<br />
in Table 3, the strengthened national policy scenario<br />
does meet both, the 20 percent RES by 2020 target<br />
<strong>and</strong> the 10 percent biofuel by 2020 target whereas<br />
the latter refers to 10 percent biofuel on solely diesel<br />
<strong>and</strong> gasoline dem<strong>and</strong>.<br />
2.2 Costs of Enhanced Renewable <strong>Energy</strong><br />
Generation<br />
Heat pumps<br />
Solar thermal heat. &<br />
water<br />
Solid biomass (non-grid)<br />
RES-H distr. heat<br />
RES-H CHP<br />
Based on the future <strong>project</strong>ions of renewable<br />
energies presented above, this section discusses the<br />
associated costs of the development in detail. The<br />
assessment of future renewable energy pathways<br />
<strong>and</strong> corresponding costs is based on the same<br />
scenario calculations seeking to meet the overall<br />
20 percent RES by 2020 target in the EU. Consumer<br />
expenditures caused by the different policy<br />
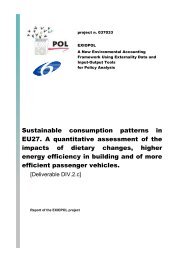
Figure 12: Future Renewable <strong>Energy</strong> Generation within the Transport Sector in the <strong>European</strong><br />
Union up to 2030 on Technology Level<br />
t<br />
u<br />
p<br />
t<br />
u<br />
o<br />
y<br />
g<br />
r<br />
e<br />
n<br />
e<br />
-<br />
T<br />
-<br />
S<br />
E<br />
R<br />
]<br />
r<br />
a<br />
e<br />
y<br />
/<br />
e<br />
o<br />
t<br />
M<br />
[<br />
40<br />
35<br />
30<br />
25<br />
20<br />
15<br />
10<br />
5<br />
0<br />
2006 2010 2015 2020 2025 2030<br />
Biofuel import<br />
Advanced biofuels<br />
Traditional biofuels<br />
10