- Page 1 and 2:
Evaluative Meanings and Disciplinar
- Page 3 and 4:
ABSTRACT The purpose of this study
- Page 5 and 6:
CONTENTS C H APT E R 1. Introductio
- Page 7 and 8:
C H APT E R 9. The second theme: Re
- Page 9 and 10:
Figure A-1 Histogram for tokens of
- Page 11 and 12:
Table 8.15 The SKILFULNESS group in
- Page 13 and 14:
CHAPTER 1. Introduction 1.1. Genera
- Page 15 and 16:
study are still not large enough fo
- Page 17 and 18:
RQ1) Is it valuable to apply a new
- Page 19 and 20:
in the way each of these evaluative
- Page 21 and 22:
disciplines feature different bodie
- Page 23 and 24:
White and Liccardi (2006) have show
- Page 25 and 26:
However, it was not possible to cla
- Page 27 and 28:
typically presented as impersonal a
- Page 29 and 30:
2.5. Applied linguistics and busine
- Page 31 and 32:
2.6.2. Business studies Business co
- Page 33 and 34: Swales (2004) thus offers a rather
- Page 35 and 36: genre has come increasingly under t
- Page 37 and 38: CHAPTER 3. Pattern, meaning and eva
- Page 39 and 40: 170). 7 On the basis of the vast am
- Page 41 and 42: 3.3. Lexico-grammatical patterns 3.
- Page 43 and 44: syntactic patterns encodes differen
- Page 45 and 46: RESULT/DATA based on DATA/THEORY In
- Page 47 and 48: (Biber, 1988, p. 237). Indeed, Chaf
- Page 49 and 50: aspect of language use. For these r
- Page 51 and 52: 1986), hedging (Holmes, 1988; Hylan
- Page 53 and 54: adverbs but rather in certain patte
- Page 55 and 56: average work is described as sound
- Page 57 and 58: are also interrelated. In an attemp
- Page 59 and 60: CHAPTER 4. Correspondence analysis
- Page 61 and 62: - end. Although there is no doubt t
- Page 63 and 64: appeal of multivariate analysis is
- Page 65 and 66: While such observations might be in
- Page 67 and 68: The contingency table has the follo
- Page 69 and 70: CHAPTER 5. Corpus creation and meth
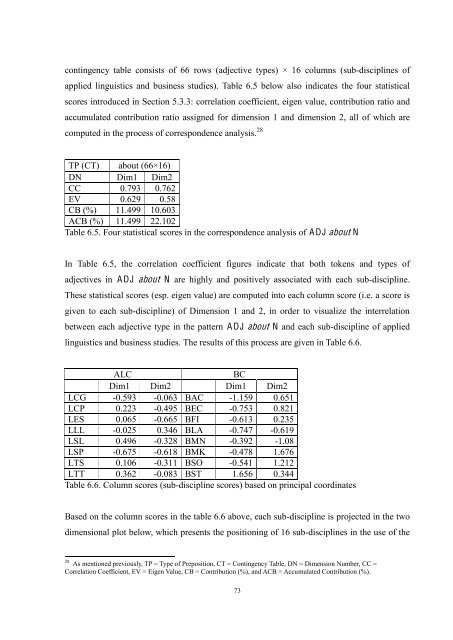
- Page 71 and 72: of sub-disciplines contained within
- Page 73 and 74: As Figure 5.1 illustrates, regardle
- Page 75 and 76: corpus-based discourse analysis. Th
- Page 77 and 78: analysis was conducted with the mat
- Page 79 and 80: 5.3.4. Discourse analysis procedure
- Page 81 and 82: CHAPTER 6. A case study In this cha
- Page 83: express human feelings: specificall
- Page 87 and 88: of this case study is limited. Howe
- Page 89 and 90: likely to express what they feel ab
- Page 91 and 92: 6.2.2. The NERVOUSNESS group While
- Page 93 and 94: adjectives in this group in the pat
- Page 95 and 96: While the LSP enthusiastic about N
- Page 97 and 98: AWARE and IGNORANT group in Francis
- Page 99 and 100: CHAPTER 7. Data analyses 7.1. Intro
- Page 101 and 102: The table is divided into high-freq
- Page 103 and 104: about of Order ALC Freq. BC Freq. B
- Page 105 and 106: Tables 7.2 and 7.3 above indicate t
- Page 107 and 108: same for a corpus of a more special
- Page 109 and 110: Table 7.5 above indicates that simi
- Page 111 and 112: about for from in of on to with 8 l
- Page 113 and 114: In the plot shown in Figure 7.1, it
- Page 115 and 116: Figure 7.4. Adjective plot in the s
- Page 117 and 118: Figure 7.7. Adjective plot for A DJ
- Page 119 and 120: Figure 7.9. Adjective plot for the
- Page 121 and 122: Figure 7.11. Adjective plot for the
- Page 123 and 124: Figure 7.13. Adjective plot for the
- Page 125 and 126: same time. This being the case, I h
- Page 127 and 128: Other adjectives in this quadrant a
- Page 129 and 130: This concludes my analysis of the e
- Page 131 and 132: Figure 7.21 also indicates that adj
- Page 133 and 134: With the sole exception of the patt
- Page 135 and 136:
evaluation (Martin & Rose, 2007, p.
- Page 137 and 138:
judgments tend to draw on both emot
- Page 139 and 140:
[Business studies: neutral about/on
- Page 141 and 142:
modals in BC, on the other hand, mo
- Page 143 and 144:
Order ALC Freq. BC Freq. 1 more 14
- Page 145 and 146:
itself. 8.1.3. Importance The third
- Page 147 and 148:
Fewer of the control variables are
- Page 149 and 150:
someone/something is certain or unc
- Page 151 and 152:
current/past oriented. While the nu
- Page 153 and 154:
monogloss heterogloss ALC 35%(7) 65
- Page 155 and 156:
that the default assumption among a
- Page 157 and 158:
monogloss heterogloss ALC 29%(4) 71
- Page 159 and 160:
general category of appreciation as
- Page 161 and 162:
while the BC examples evaluate the
- Page 163 and 164:
it seems that researchers in busine
- Page 165 and 166:
Overall, my findings suggest that a
- Page 167 and 168:
interpretation. Finally, these sema
- Page 169 and 170:
entities. This group is especially
- Page 171 and 172:
[Applied Linguistics] [
- Page 173 and 174:
The proportions for this group are
- Page 175 and 176:
In addition, this LSP strongly occu
- Page 177 and 178:
or evidence in the writers (ongoing
- Page 179 and 180:
Francis et al. (1998, p. 479) indic
- Page 181 and 182:
In summary, the intensity of severa
- Page 183 and 184:
The depended- entities in ALC are p
- Page 185 and 186:
order ALC freq. BC freq. 1 differen
- Page 187 and 188:
[Business Studies] Thi
- Page 189 and 190:
[Applied Linguistics] Scores (but
- Page 191 and 192:
In general, business studies discou
- Page 193 and 194:
Order ALC Freq. BC Freq. 1 involved
- Page 195 and 196:
[Applied Linguistics]
- Page 197 and 198:
[Business Studies] Language is
- Page 199 and 200:
something (e.g. ability, knowledge,
- Page 201 and 202:
[Business Studies] Only companies
- Page 203 and 204:
adverbs. Table 9.18 below summarize
- Page 205 and 206:
Order ALC Freq. BC Freq. 1 responsi
- Page 207 and 208:
Order ALC Freq. BC Freq. 1 present
- Page 209 and 210:
ALC BC Negative Noun inherent other
- Page 211 and 212:
In each of the above concordances t
- Page 213 and 214:
Several adjectives in this group in
- Page 215 and 216:
[Business Studies] Our sample is r
- Page 217 and 218:
Order ALC Freq. BC Freq. 1 study 27
- Page 219 and 220:
[Business studies: model + based on
- Page 221 and 222:
particular thing in order to deepen
- Page 223 and 224:
across the two disciplines. However
- Page 225 and 226:
A DJ PR EP N. Figure 10.1. Discipli
- Page 227 and 228:
likely to occur in applied linguist
- Page 229 and 230:
10.3.2. Cause vs. Effect As argued
- Page 231 and 232:
and unostentatious fashion. This fi
- Page 233 and 234:
10.4. Conclusion The fundamental as
- Page 235 and 236:
as follows: [A new methodology] RQ1
- Page 237 and 238:
linguistics and business studies on
- Page 239 and 240:
disciplinary culture of the two dis
- Page 241 and 242:
p. 156). By investigating a corpus,
- Page 243 and 244:
Figure A-3: Histogram for types of
- Page 245 and 246:
Appendix B: Tables for adjectives i
- Page 247 and 248:
vague 1 worried 1 1 2 1 2 1 wrong 1
- Page 249 and 250:
indispensable 1 1 ineligible 2 1 in
- Page 251 and 252:
indistinguishable 8 4 1 1 1 1 2 1 i
- Page 253 and 254:
immersed 1 1 1 1 1 2 2 implicated 4
- Page 255 and 256:
Table B-10. Contingency table for t
- Page 257 and 258:
12 conditional 3 clear 5 26 good 1
- Page 259 and 260:
51 free 17 unique 18 141 antagonist
- Page 261 and 262:
comparable 21 2 8 3 1 2 3 11 3 4 7
- Page 263 and 264:
new 2 12 1 11 2 5 4 8 3 2 9 3 45 ne
- Page 265 and 266:
27 comparable 4 competitive 3 68 si
- Page 267 and 268:
pregnant 1 preoccupied 2 1 1 replet
- Page 269 and 270:
crucial-as 1 effecti
- Page 271 and 272:
puzzled-by 1 recogni
- Page 273 and 274:
SRHE/Open University Press Bell, R.
- Page 275 and 276:
articles in biology and history. In
- Page 277 and 278:
Herbert, A. (1965). The structure o
- Page 279 and 280:
Lewis, M. (1997). Implementing the
- Page 281 and 282:
Rundell, M. (Ed.). (2007). Macmilla
- Page 283:
functional perspective. English for