Download the file. - Groupe Seb
Download the file. - Groupe Seb
Download the file. - Groupe Seb

Create successful ePaper yourself
Turn your PDF publications into a flip-book with our unique Google optimized e-Paper software.
Transport-related CO 2 emissions<br />
The carbon footprint linked with <strong>the</strong> transport of products,<br />
materials and components was estimated at 250,325 tonnes<br />
equivalent CO 2 for 2011. This has <strong>the</strong>refore decreased compared with<br />
2010 (-6%), in spite of <strong>the</strong> organic growth of <strong>the</strong> Group and its turnover.<br />
This data covers a worldwide range, with data from <strong>the</strong> new acquisitions<br />
of Asia Fan and Imusa having been extrapolated.<br />
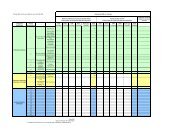
USE OF DIRECT RAW MATERIALS FOR FINISHED<br />
PRODUCTS MANUFACTURED<br />
Metals: 85,962 tonnes<br />
of which motors 30,111 tonnes<br />
Plastics: 48,100 tonnes<br />
Packaging: 31,331 tonnes<br />
USE OF INDIRECT RAW MATERIALS<br />
FOR PROCESSES, BUILDINGS AND EMPLOYEES<br />
LPG: 819 tonnes<br />
Natural gas: 148.3 gWh<br />
Electricity: 158.7 gWh<br />
Fuel excluding transport fuel: 32 m 3<br />
Water: 997.9 thousand m 3<br />
FINISHED PRODUCTS<br />
180,423 tonnes of finished products manufactured, excluding sourced products, in 2011.<br />
Finished electrical products and cookware manufactured in 2011 are 77% recyclable.<br />
USE OF RESOURCES BY FINISHED PRODUCT MANUFACTURED<br />
2010 2011<br />
Gas (kWh) 1.92 1.65<br />
Electricity (kWh) 1.76 1.76<br />
Water (l) 11.09 11.08<br />
82 Business and Sustainable Development Report 2011