2008 Budget Book - Kitsap County Government
2008 Budget Book - Kitsap County Government
2008 Budget Book - Kitsap County Government

Create successful ePaper yourself
Turn your PDF publications into a flip-book with our unique Google optimized e-Paper software.
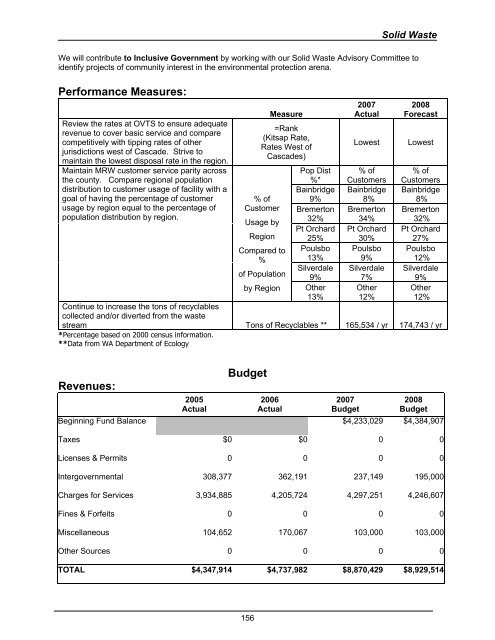
Solid Waste<br />
We will contribute to Inclusive <strong>Government</strong> by working with our Solid Waste Advisory Committee to<br />
identify projects of community interest in the environmental protection arena.<br />
Performance Measures:<br />
Review the rates at OVTS to ensure adequate<br />
revenue to cover basic service and compare<br />
competitively with tipping rates of other<br />
jurisdictions west of Cascade. Strive to<br />
maintain the lowest disposal rate in the region.<br />
Maintain MRW customer service parity across<br />
the county. Compare regional population<br />
distribution to customer usage of facility with a<br />
goal of having the percentage of customer<br />
usage by region equal to the percentage of<br />
population distribution by region.<br />
Measure<br />
=Rank<br />
(<strong>Kitsap</strong> Rate,<br />
Rates West of<br />
Cascades)<br />
% of<br />
Customer<br />
Usage by<br />
Region<br />
Compared to<br />
%<br />
of Population<br />
by Region<br />
Pop Dist<br />
%*<br />
Bainbridge<br />
9%<br />
Bremerton<br />
32%<br />
Pt Orchard<br />
25%<br />
Poulsbo<br />
13%<br />
Silverdale<br />
9%<br />
Other<br />
13%<br />
2007<br />
Actual<br />
Lowest<br />
% of<br />
Customers<br />
Bainbridge<br />
8%<br />
Bremerton<br />
34%<br />
Pt Orchard<br />
30%<br />
Poulsbo<br />
9%<br />
Silverdale<br />
7%<br />
Other<br />
12%<br />
<strong>2008</strong><br />
Forecast<br />
Lowest<br />
% of<br />
Customers<br />
Bainbridge<br />
8%<br />
Bremerton<br />
32%<br />
Pt Orchard<br />
27%<br />
Poulsbo<br />
12%<br />
Silverdale<br />
9%<br />
Other<br />
12%<br />
Continue to increase the tons of recyclables<br />
collected and/or diverted from the waste<br />
stream Tons of Recyclables ** 165,534 / yr 174,743 / yr<br />
*Percentage based on 2000 census information.<br />
**Data from WA Department of Ecology<br />
Revenues:<br />
2005<br />
Actual<br />
<strong>Budget</strong><br />
2006<br />
Actual<br />
2007<br />
<strong>Budget</strong><br />
<strong>2008</strong><br />
<strong>Budget</strong><br />
Beginning Fund Balance $4,233,029 $4,384,907<br />
Taxes $0 $0 0 0<br />
Licenses & Permits 0 0 0 0<br />
Intergovernmental 308,377 362,191 237,149 195,000<br />
Charges for Services 3,934,885 4,205,724 4,297,251 4,246,607<br />
Fines & Forfeits 0 0 0 0<br />
Miscellaneous 104,652 170,067 103,000 103,000<br />
Other Sources 0 0 0 0<br />
TOTAL $4,347,914 $4,737,982 $8,870,429 $8,929,514<br />
156