2008 Budget Book - Kitsap County Government
2008 Budget Book - Kitsap County Government
2008 Budget Book - Kitsap County Government

Create successful ePaper yourself
Turn your PDF publications into a flip-book with our unique Google optimized e-Paper software.
Appendix G<br />
Revenue Projection<br />
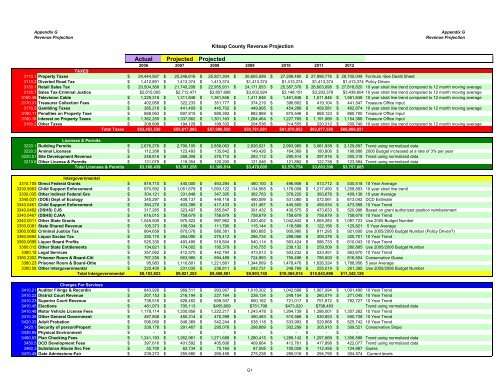
<strong>Kitsap</strong> <strong>County</strong> Revenue Projection<br />
Appendix G<br />
Revenue Projection<br />
Actual Projected Projected<br />
2006 2007 <strong>2008</strong> 2009 2010 2011 2012<br />
TAXES<br />
3110.1 Property Taxes $ 24,444,567 $ 25,246,616 $ 25,921,304 $ 26,605,599 $ 27,298,490 $ 27,998,776 $ 28,705,049 Formula -See Deatil Sheet<br />
3110.2 Diverted Road Tax $ 1,412,891 $ 1,413,374 $ 1,413,374 $1,413,374 $1,413,374 $1,413,374 $1,413,374 Policy Driven<br />
3130.1 Retail Sales Tax $ 20,504,366 $ 21,740,208 $ 22,955,931 $ 24,171,653 $ 25,387,376 $ 26,603,098 $ 27,818,820 10 year strait line trend compared to 12 month moving average<br />
3130.7 Sales Tax-Criminal Justice $2,615,005 $2,712,471 $2,857,698 $3,002,924 $3,148,151 $3,293,378 $3,438,604 10 year strait line trend compared to 12 month moving average<br />
3160.46 Television Cable $ 1,229,318 $ 1,311,846 $ 1,361,846 $ 1,411,846 $ 1,461,846 $ 1,511,846 $ 1,561,846 10 year strait line trend compared to 12 month moving average<br />
3170.31 Treasurer Collection Fees $ 402,958 $ 322,233 $ 351,777 $ 374,219 $ 396,662 $ 419,104 $ 441,547 Treasure Office Input<br />
3170.5 Gambling Taxes $ 385,218 $ 441,409 $ 445,702 $ 449,995 $ 454,288 $ 458,581 $ 462,874 10 year strait line trend compared to 12 month moving average<br />
3190.11 Penalties on Property Taxe $ 888,063 $ 897,815 $ 890,392 $ 882,969 $ 875,546 $ 868,123 $ 860,700 Treasure Office Input<br />
3190.16 Interest on Property Taxes $ 1,362,255 $ 1,337,862 $ 1,301,163 $ 1,264,464 $ 1,227,765 $ 1,191,066 $ 1,154,366 Treasure Office Input<br />
3160.2 Other Taxes $ 208,898 $ 194,128 $ 199,332 $ 204,536 $ 214,555 $ 220,212 $ 209,740 10 year strait line trend compared to 12 month moving average<br />
Total Taxes $53,453,539 $55,617,965 $57,698,520 $59,781,581 $61,878,052 $63,977,558 $66,066,921<br />
Licenses & Permits<br />
3220.1 Building Permits $ 2,676,278 $ 2,790,105 $ 2,858,063 $ 2,926,021 $ 2,993,980 $ 3,061,938 $ 3,129,897 Trend using normalized data<br />
3220.3 Animal Licenses $ 112,266 $ 123,493 $ 135,842 $ 149,426 $ 164,369 $ 180,806 $ 198,886 2006 <strong>Budget</strong> increased at a rate of 3% per year<br />
3220.51 Site Development Revenue $ 248,816 $ 268,308 $ 275,710 $ 283,112 $ 290,514 $ 297,916 $ 305,318 Trend using normalized data<br />
3210.6 Other License & Permits $ 131,079 $ 119,354 $ 120,200 $ 121,046 $ 121,892 $ 122,738 $ 123,584 Trend using normalized data<br />
Total Licenses & Permits $3,168,439 $3,301,258 $3,389,814 $3,479,605 $3,570,754 $3,663,398 $3,757,685<br />
Intergovernmental<br />
3310.105 Direct Federal Grants $ 819,710 $ 440,000 $ 463,294 $ 480,100 $ 496,906 $ 513,712 $ 530,518 10 Year Average<br />
3330.9563 Child Support Enforcement $ 970,592 $ 1,051,679 $ 1,093,122 $ 1,134,565 $ 1,176,008 $ 1,217,450 $ 1,258,893 10 year strait line trend<br />
3330.035 Other Indirect Federal Gra $ 304,121 $ 331,848 $ 347,305 $ 362,763 $ 378,220 $ 393,678 $ 409,136 10 year Average<br />
3340.031 (DOE) Dept of Ecology $ 340,297 $ 408,137 $ 449,118 $ 490,099 $ 531,080 $ 572,061 $ 613,042 DCD Estimate<br />
3340.0461 Child Support Enforcement $ 364,270 $ 403,399 $ 417,433 $ 431,467 $ 445,500 $ 459,534 $ 473,568 10 Year Trend<br />
3340.0462 (DSHS) CJS $ 317,265 $ 323,497 $ 355,847 $ 391,432 $ 430,575 $ 473,633 $ 520,996 Based on grant authorized position reimbersment<br />
3340.0467 (DSHS) CJAA $ 616,015 $ 758,679 $ 758,679 $ 758,679 $ 758,679 $ 758,679 $ 758,679 10 Year Trend<br />
3340.0011 Other State Grants $ 1,045,500 $ 975,522 $ 997,962 $ 1,020,402 $ 1,042,842 $ 1,065,283 $ 1,087,723 Use 2005 <strong>Budget</strong> Number<br />
3350.0081 State Shared Revenue $ 105,373 $ 108,534 $ 111,790 $ 115,144 $ 118,598 $ 122,156 $ 125,821 5 Year Average<br />
3360.0082 Criminal Justice Tax $ 864,659 $ 870,076 $ 880,381 $ 890,685 $ 900,990 $ 911,295 $ 921,600 Use 2005/2006 <strong>Budget</strong> Number (Policy Driven?)<br />
3360.0694 Liquor Excise Tax $ 250,170 $ 264,090 $ 275,412 $ 286,734 $ 298,056 $ 309,379 $ 320,701 10 Year Trend<br />
3360.0695 Liquor Board Profits $ 525,330 $ 493,495 $ 516,804 $ 540,114 $ 563,424 $ 586,733 $ 610,043 10 Year Trend<br />
3360.012 Other State Entitlements $ 134,821 $ 174,002 $ 195,379 $ 216,755 $ 238,132 $ 259,509 $ 280,885 Use 2005/2006 <strong>Budget</strong> Number<br />
3380.15 Legal Services $ 357,062 $ 412,575 $ 442,794 $ 473,013 $ 503,232 $ 533,451 $ 563,670 10 Year Trend<br />
3380.2302 Prisoner Room & Board-Citi $ 767,255 $ 663,985 $ 694,489 $ 724,993 $ 755,496 $ 786,000 $ 816,504 Conservative Guess<br />
3380.23 Prisoner Room & Board-Othe $ 95,983 $ 1,110,801 $ 1,221,881 $ 1,344,069 $ 1,478,476 $ 1,626,324 $ 1,788,956 5 year Average<br />
3380.58 Other Intergovernmental $ 225,400 $ 231,035 $ 236,811 $ 242,731 $ 248,799 $ 255,019 $ 261,395 Use 2005/2006 <strong>Budget</strong> Number<br />
Total Intergovernmental $8,103,823 $9,021,353 $9,458,501 $9,903,745 $10,365,015 $10,843,896 $11,342,129<br />
Charges For Services<br />
3410.21 Auditor Filings & Recordin $ 843,928 $ 969,511 $ 993,907 $ 1,018,302 $ 1,042,698 $ 1,067,094 $ 1,091,490 10 Year Trend<br />
3410.22 District Court Revenue $ 207,153 $ 216,194 $ 227,164 $ 238,134 $ 249,104 $ 260,074 $ 271,045 10 Year Trend<br />
3410.23 Superior Court Revenue $ 736,516 $ 628,452 $ 659,307 $ 690,162 $ 721,017 $ 751,872 $ 782,727 10 Year Trend<br />
3410.45 Elections $ 481,973 $ 705,113 $455,609 $751,798 $473,020 $798,483 Trend using normalized data<br />
3410.48 Motor Vehicle License Fees $ 1,178,114 $ 1,200,956 $ 1,222,217 $ 1,243,478 $ 1,264,739 $ 1,286,001 $ 1,307,262 10 Year Trend<br />
3410.35 Other General <strong>Government</strong> $ 487,808 $ 450,314 $ 470,399 $ 490,483 $ 510,568 $ 530,653 $ 550,738 10 Year Trend<br />
3420.33 Adult Probation $ 596,060 $ 546,369 $ 542,244 $ 538,118 $ 533,993 $ 529,868 $ 525,742 10 Year Trend<br />
3420.1 Security of person/Propert $ 339,178 $ 291,467 $ 295,078 $ 298,689 $ 302,299 $ 305,910 $ 309,521 Conservative Slope<br />
3430.95 Physical Environment $ - $ - $ - $ - $ - $ - $ -<br />
3450.83 Plan Checking Fees $ 1,241,193 $ 1,262,961 $ 1,271,688 $ 1,280,415 $ 1,289,142 $ 1,297,869 $ 1,306,596 Trend using normalized data<br />
3450.5 DCD Development Fees $ 397,616 $ 401,592 $ 405,608 $ 409,664 $ 413,761 $ 417,898 $ 422,077 Trend using normalized data<br />
3460.3 Substance Abuse Svc Fee $ 52,700 $ 62,734 $ 75,165 $ 87,595 $ 100,026 $ 112,456 $ 124,887 Guess<br />
3470.45 Gate Admissions-Fair $ 239,273 $ 255,680 $ 265,459 $ 275,238 $ 285,016 $ 294,795 $ 304,574 Current levels<br />
G1