2013 Water System Plan, Volume II - Seattle City Clerk's Office - City ...
2013 Water System Plan, Volume II - Seattle City Clerk's Office - City ...
2013 Water System Plan, Volume II - Seattle City Clerk's Office - City ...

Create successful ePaper yourself
Turn your PDF publications into a flip-book with our unique Google optimized e-Paper software.
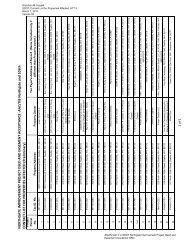
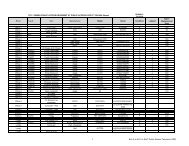
Components of Actual and Forecast <strong>Water</strong> Demand<br />
All figures in millions of gallons per day (MGD)<br />
Billed Demand<br />
Non- Total <strong>System</strong> Demand<br />
Year <strong>Seattle</strong> Retail<br />
Wholesale<br />
Revenue Annual Peak<br />
SF Res MF Res Non-Res Subtotal F&P 1 Block 2 New 3 Subtotal <strong>Water</strong> Average 4 Day 5<br />
2000 26.9 14.5 27.7 69.1 34.3 31.7 - 66.0 13.2 148.2 241.9<br />
2001 24.0 13.7 24.6 62.3 30.0 30.8 - 60.7 11.6 134.6 204.0<br />
A 2002 24.8 13.1 24.9 62.8 32.9 31.0 - 63.9 9.8 136.5 222.6<br />
C 2003 24.9 12.8 24.6 62.3 35.6 32.7 - 68.2 9.4 139.9 250.2<br />
T 2004 24.2 12.5 24.6 61.3 33.1 33.3 - 66.4 14.0 141.7 246.8<br />
U 2005 22.6 12.2 23.2 58.0 29.6 31.4 - 61.0 7.7 126.7 210.4<br />
A 2006 23.5 12.3 23.7 59.5 32.0 33.4 - 65.4 6.3 131.2 236.8<br />
L 2007 22.6 12.0 23.6 58.3 28.7 33.7 - 62.5 5.2 125.9 227.6<br />
2008 22.0 11.8 22.5 56.3 28.8 32.0 - 60.8 8.2 125.3 202.0<br />
2009 23.1 11.6 22.6 57.3 30.6 34.1 - 64.8 7.5 129.5 241.9<br />
2010 21.3 11.4 21.6 54.3 26.5 29.6 - 56.1 8.0 118.4 197.9<br />
2010 21.9 11.4 21.6 55.0 28.0 41.9 0.0 69.9 8.0 132.8 265.7<br />
2011 21.5 11.5 21.2 54.2 28.2 41.9 0.0 70.1 8.0 132.3 264.7<br />
2012 21.2 11.6 21.0 53.8 28.1 41.9 0.1 70.0 8.1 131.9 263.8<br />
F <strong>2013</strong> 20.9 11.6 20.8 53.3 27.9 41.9 0.1 69.9 8.1 131.3 262.6<br />
O 2014 20.7 11.7 20.7 53.0 28.1 41.9 0.2 70.1 8.2 131.2 262.5<br />
R 2015 20.4 11.7 20.6 52.8 28.1 41.9 0.2 70.2 8.2 131.2 262.3<br />
E 2016 20.3 11.8 20.9 53.0 27.3 41.9 0.3 69.4 8.2 130.6 261.3<br />
C 2017 20.2 11.8 21.1 53.2 26.5 41.9 0.3 68.6 8.3 130.1 260.1<br />
A 2018 20.1 11.9 21.3 53.3 26.6 43.9 0.4 70.8 8.3 132.4 264.8<br />
S 2019 19.9 12.0 21.5 53.4 26.8 43.9 0.4 71.0 8.4 132.7 265.5<br />
T 2020 19.7 12.0 21.7 53.5 26.9 43.9 0.5 71.2 8.4 133.1 266.2<br />
2021 19.5 12.1 22.0 53.6 26.9 43.9 0.5 71.3 8.4 133.3 266.7<br />
2022 19.3 12.1 22.3 53.7 27.0 43.9 0.6 71.4 8.5 133.6 267.2<br />
2023 19.1 12.1 22.6 53.9 27.0 43.9 0.6 71.5 8.5 133.9 267.7<br />
2024 18.9 12.2 22.9 54.0 27.1 33.9 0.7 61.6 8.6 124.1 248.3<br />
2025 18.7 12.2 23.2 54.2 27.1 33.9 0.7 61.7 8.6 124.5 248.9<br />
2026 18.5 12.3 23.5 54.3 27.2 33.9 0.8 61.8 8.6 124.8 249.5<br />
2027 18.3 12.3 23.8 54.5 27.2 33.9 0.8 61.9 8.7 125.1 250.1<br />
2028 18.1 12.4 24.1 54.6 27.3 33.9 0.9 62.0 8.7 125.4 250.7<br />
2029 18.0 12.5 24.3 54.8 27.4 33.9 0.9 62.1 8.8 125.7 251.3<br />
2030 17.8 12.5 24.6 54.9 27.5 28.9 0.9 57.3 8.8 121.0 241.9<br />
2031 17.7 12.7 25.0 55.4 27.8 28.9 1.0 57.6 8.8 121.8 243.6<br />
2032 17.7 12.9 25.4 55.9 28.1 28.9 1.0 57.9 8.9 122.7 245.4<br />
2033 17.6 13.0 25.8 56.4 28.4 28.9 1.0 58.2 8.9 123.6 247.1<br />
2034 17.6 13.2 26.1 57.0 28.7 28.9 1.0 58.5 9.0 124.4 248.9<br />
2035 17.6 13.4 26.5 57.5 29.0 23.9 1.0 53.9 9.0 120.3 240.7<br />
2036 17.5 13.6 26.9 58.0 29.3 23.9 1.0 54.2 9.0 121.3 242.5<br />
2037 17.5 13.8 27.3 58.6 29.7 23.9 1.0 54.5 9.1 122.2 244.4<br />
2038 17.5 13.9 27.7 59.2 30.1 23.9 1.0 54.9 9.1 123.2 246.4<br />
2039 17.5 14.1 28.1 59.7 30.4 23.9 1.0 55.3 9.2 124.2 248.3<br />
2040 17.5 14.3 28.5 60.3 30.8 18.9 1.0 50.6 9.2 120.2 240.3<br />
5 2045 17.6 15.2 29.4 62.2 32.5 13.9 1.0 47.4 9.4 119.0 237.9<br />
2050 17.8 16.1 30.4 64.3 34.6 13.9 1.0 49.4 9.6 123.3 246.5<br />
Y 2055 18.0 17.3 31.4 66.6 36.8 13.9 1.0 51.7 9.8 128.1 256.2<br />
R 2060 18.2 18.6 32.4 69.2 39.3 13.9 1.0 54.1 10.0 133.4 266.8<br />
1. F&P refers to Full and Partial contracts wholesale customers.<br />
2. The forecast of demand from Cascade <strong>Water</strong> Alliance (Cascade) and Northshore is equal to their blocks while the historical consumption data<br />
reflects water actually purchased from SPU by Cascade members and Northshore. The blocks exceeded actual water purchases from SPU of<br />
Cascade members and Northshore by 12 mgd in 2010.<br />
3. Potential new wholesale customers<br />
4. The forecast of Total <strong>System</strong> Demand includes the Northshore and Cascade blocks while the historical consumption data reflects SPU water<br />
actually purchased by Northshore and Cascade.<br />
5. The forecast of peak day demand is based on a peak day factor of 2.0, the ratio of peak day to average annual demand in 2009 with a 5%<br />
allowance for hot, dry weather. The forecast of average annual demand under average weather conditions is multiplied by the peak day factor<br />
to estimate peak day demand with hot, dry weather.<br />
FINAL Page 11 of 22 December 2011