- Page 1 and 2: 2013 Water System Plan Our Water. O
- Page 3 and 4: Seattle Public Utilities 2013 Water
- Page 5 and 6: SPU 2013 Water System Plan 2013 Wat
- Page 7 and 8: SEATTLE PUBLIC UTILITIES 2013 WATER
- Page 9 and 10: SEATTLE PUBLIC UTILITIES 2013 WATER
- Page 11 and 12: 2013 Water System Plan Official Yie
- Page 13 and 14: WATER DEMAND FORECAST MODEL STRUCTU
- Page 15 and 16: Household size is calculated for si
- Page 17 and 18: Annual Growth in Average Water Rate
- Page 19 and 20: forecast by subtracting the project
- Page 21 and 22: Components of Actual and Forecast W
- Page 23: The graph below contrasts the offic
- Page 27 and 28: the extent to which price-induced c
- Page 29 and 30: Passive Savings: Passive savings co
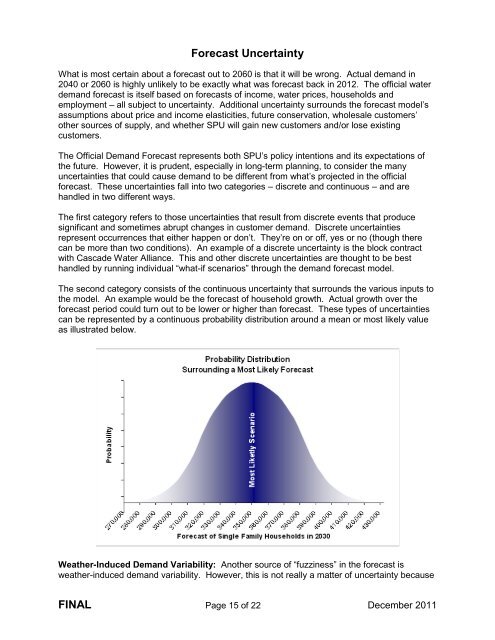
- Page 31 and 32: The uncertainty model represents a
- Page 33 and 34: SEATTLE PUBLIC UTILITIES 2013 WATER
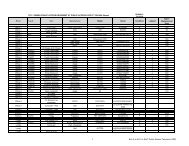
- Page 35 and 36: Permit Certificate or Claim # Prior
- Page 37 and 38: Permit Certificate or Claim # Name
- Page 39 and 40: SEATTLE PUBLIC UTILITIES 2013 WATER
- Page 41 and 42: Groundwater Elevations at Seattle W
- Page 43 and 44: SEATTLE PUBLIC UTILITIES 2013 WATER
- Page 45 and 46: Forquestions,callKristinaWestbrook,
- Page 47 and 48: WaterReclamationEvaluationChecklist
- Page 49 and 50: SEATTLE PUBLIC UTILITIES 2013 WATER
- Page 51 and 52: SEATTLE PUBLIC UTILITIES 2013 WATER
- Page 53 and 54: 9. 24 HOUR PRIMARY CONTACT INFORMAT
- Page 55 and 56: 1. SYSTEM ID NO. 77050 Y WATER FACI
- Page 57 and 58: SEATTLE PUBLIC UTILITIES 2013 WATER
- Page 59 and 60: Water System Management and Operato
- Page 61 and 62: SPU 2013 Water System Plan Appendix
- Page 63 and 64: SPU 2013 Water System Plan Appendix
- Page 65 and 66: SEATTLE PUBLIC UTILITIES 2013 WATER
- Page 67 and 68: Water Treatment Chemicals February
- Page 69 and 70: SEATTLE PUBLIC UTILITIES 2013 WATER
- Page 71 and 72: Table 1 Tolt Water Treatment Facili
- Page 73 and 74: Table 3 Seattle Well Fields Treatme
- Page 75 and 76:
Table 5 Transmission Pipelines Pipe
- Page 77 and 78:
Year Const. Capacity (MG) Table 7 S
- Page 79 and 80:
Table 9 Regional and Sub-Regional S
- Page 81 and 82:
Table 11 Metered Connections by Cla
- Page 83 and 84:
Purveyor and SPU Meter No. SPU Stat
- Page 85 and 86:
Purveyor and SPU Meter No. SPU Stat
- Page 87 and 88:
SEATTLE PUBLIC UTILITIES 2013 WATER
- Page 89 and 90:
SEATTLE PUBLIC UTILITIES 2013 WATER
- Page 91 and 92:
Seattle Public Utilities Comprehens
- Page 93 and 94:
coliform, E. Coli, or HPC, and noti
- Page 95 and 96:
Stage 2 Rule will be based on locat
- Page 97 and 98:
2.2. Future Regulations The future
- Page 99 and 100:
Parameter Locations Frequency Monit
- Page 101 and 102:
Parameter Total Coliform - QT Table
- Page 103 and 104:
SEATTLE PUBLIC UTILITIES 2013 WATER
- Page 105 and 106:
Chapter 5 Water Infrastructure Cont
- Page 107 and 108:
Chapter 5 Water Infrastructure Chap
- Page 109 and 110:
Chapter 5 Water Infrastructure Term
- Page 111 and 112:
Chapter 5 Water Infrastructure 5.2.
- Page 113 and 114:
Chapter 5 Water Infrastructure Infr
- Page 115 and 116:
Chapter 5 Water Infrastructure 5.3
- Page 117 and 118:
Chapter 5 Water Infrastructure Tabl
- Page 119 and 120:
Chapter 5 Water Infrastructure U.S.
- Page 121 and 122:
Chapter 5 Water Infrastructure Tabl
- Page 123 and 124:
Chapter 5 Water Infrastructure 5.6.
- Page 125 and 126:
Chapter 5 Water Infrastructure 5.6.
- Page 127 and 128:
Chapter 5 Water Infrastructure prop
- Page 129 and 130:
Chapter 5 Water Infrastructure are
- Page 131 and 132:
Chapter 5 Water Infrastructure outs
- Page 133 and 134:
Chapter 5 Water Infrastructure most
- Page 135 and 136:
Chapter 5 Water Infrastructure Groo
- Page 137 and 138:
Chapter 5 Water Infrastructure 5.6.
- Page 139 and 140:
Chapter 5 Water Infrastructure Valv
- Page 141 and 142:
Chapter 5 Water Infrastructure leve
- Page 143 and 144:
Chapter 5 Water Infrastructure 2. A
- Page 145 and 146:
Chapter 5 Water Infrastructure Tabl
- Page 147 and 148:
Chapter 5 Water Infrastructure 5.8.
- Page 149 and 150:
Chapter 5 Water Infrastructure Ever
- Page 151 and 152:
Chapter 5 Water Infrastructure A. C
- Page 153 and 154:
Chapter 5 Water Infrastructure 5.8.
- Page 155 and 156:
Chapter 5 Water Infrastructure Mult
- Page 157 and 158:
Chapter 5 Water Infrastructure 5.9.
- Page 159 and 160:
Chapter 5 Water Infrastructure Fast
- Page 161 and 162:
Chapter 5 Water Infrastructure 5.9.
- Page 163 and 164:
Chapter 5 Water Infrastructure 3. T
- Page 165 and 166:
Chapter 5 Water Infrastructure 5.9.
- Page 167 and 168:
Chapter 5 Water Infrastructure Hatc
- Page 169 and 170:
Chapter 5 Water Infrastructure 5.9.
- Page 171 and 172:
Chapter 5 Water Infrastructure Thru
- Page 173 and 174:
Chapter 5 Water Infrastructure 5.10
- Page 175 and 176:
Chapter 5 Water Infrastructure Foll
- Page 177 and 178:
Chapter 5 Water Infrastructure Cont
- Page 179 and 180:
SEATTLE PUBLIC UTILITIES 2013 WATER
- Page 181 and 182:
Chapter 18 Plan Review Contents Cha
- Page 183 and 184:
18.2 GENERAL INFORMATION This secti
- Page 185 and 186:
Figure 18-1 Development Permit Boun
- Page 187 and 188:
18.3.1.5 Street Use Permit SDOT iss
- Page 189 and 190:
3. The Conditional Reviewer enters
- Page 191 and 192:
Table 18-2 Information Included in
- Page 193 and 194:
5 working days. If an SPU plan revi
- Page 195 and 196:
esponsibility in verifying and prot
- Page 197 and 198:
RPS sends letter to property owner
- Page 199 and 200:
Table 18-4 Plan Review Roles and Re
- Page 201 and 202:
Stormwater Code(2009) SMC Chapter 2
- Page 203 and 204:
each pay period, SPU Finance sends
- Page 205 and 206:
SEATTLE PUBLIC UTILITIES 2013 WATER
- Page 207 and 208:
Director’s Rule Title Standard, C
- Page 209 and 210:
Other New Service Installation Stan
- Page 211 and 212:
Exception: To renew and increase ½
- Page 213 and 214:
• Adjust buried, obstructed or lo
- Page 215 and 216:
3.16 HYDRANT RESET Set hydrant back
- Page 217 and 218:
4. DEVELOPER PROJECTS Note: Charges
- Page 219 and 220:
5. PROPERTY SERVICES SPU must charg
- Page 221 and 222:
elow- or above-ground structure mea
- Page 223 and 224:
6. LABORATORY ANALYSIS All laborato
- Page 225 and 226:
SEATTLE PUBLIC UTILITIES 2012-2014
- Page 227 and 228:
Effective January 1, 2014 (a) (b) (
- Page 229 and 230:
SEATTLE PUBLIC UTILITIES 2013 WATER
- Page 231 and 232:
Policy and Procedure Title Water Av
- Page 233 and 234:
1) Location of the property, includ
- Page 235 and 236:
J. The easement for an SPU-owned ma
- Page 237 and 238:
SEATTLE PUBLIC UTILITIES 2013 WATER
- Page 249 and 250:
SEATTLE PUBLIC UTILITIES 2013 WATER
- Page 251 and 252:
Seattle Public Utilities System Sto
- Page 253 and 254:
actual experience with the 1987 Tol
- Page 255 and 256:
pipelines to lower pressure zones t
- Page 257 and 258:
Pressure Zone West Seattle 498 West
- Page 259 and 260:
SEATTLE PUBLIC UTILITIES 2013 WATER
- Page 261 and 262:
SEATTLE PUBLIC UTILITIES 2013 WATER
- Page 263 and 264:
Seattle Public Utilities - 2013 Wat
- Page 265 and 266:
SEATTLE PUBLIC UTILITIES 2013 WATER
- Page 267:
DELRIDGE WY SW Haller Lake INTERSTA
- Page 273 and 274:
SEATTLE PUBLIC UTILITIES 2013 WATER
- Page 275 and 276:
Seattle Public Utilities 2013 Water
- Page 277 and 278:
Water System Planning Handbook Chap
- Page 279 and 280:
Water System Planning Handbook Chap