2013 Water System Plan, Volume II - Seattle City Clerk's Office - City ...
2013 Water System Plan, Volume II - Seattle City Clerk's Office - City ...
2013 Water System Plan, Volume II - Seattle City Clerk's Office - City ...

Create successful ePaper yourself
Turn your PDF publications into a flip-book with our unique Google optimized e-Paper software.
plus 350%, resulting in projected annual growth rates in real prices of between 0.2% and<br />
1.8%.<br />
The model handles the impact on price of different levels of projected demand in a different<br />
way. Given the same set of revenue requirements, lower demand results in higher water<br />
prices and vice versa. That means that price effects would be expected to amplify swings in<br />
demand. For example, higher-than-projected demographic growth would cause demand to<br />
be higher than the official forecast, resulting in reduced prices and an additional boost in<br />
demand. The amount of the boost is determined by the price elasticity of demand and the<br />
amount by which prices fall. Incorporating this demand-price-demand-etc. feedback loop<br />
explicitly into the model isn’t feasible because, as is explained in more detail below, the<br />
uncertainty analysis involves running 10,000 iterations of the demand model. However, the<br />
feedback loop has been approximated by widening the range of uncertainty around growth<br />
in households and employment. The amounts by which the ranges have been increased<br />
are 5.2% on the high side and 5.3% on the low side 7 .<br />
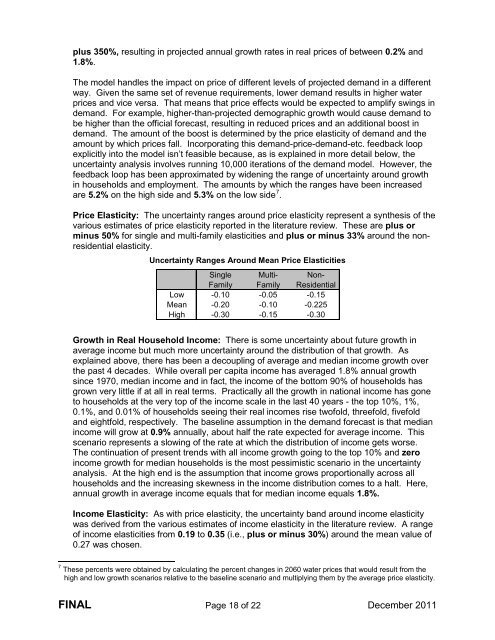
Price Elasticity: The uncertainty ranges around price elasticity represent a synthesis of the<br />
various estimates of price elasticity reported in the literature review. These are plus or<br />
minus 50% for single and multi-family elasticities and plus or minus 33% around the nonresidential<br />
elasticity.<br />
Uncertainty Ranges Around Mean Price Elasticities<br />
Single Multi- Non-<br />
Family Family Residential<br />
Low -0.10 -0.05 -0.15<br />
Mean -0.20 -0.10 -0.225<br />
High -0.30 -0.15 -0.30<br />
Growth in Real Household Income: There is some uncertainty about future growth in<br />
average income but much more uncertainty around the distribution of that growth. As<br />
explained above, there has been a decoupling of average and median income growth over<br />
the past 4 decades. While overall per capita income has averaged 1.8% annual growth<br />
since 1970, median income and in fact, the income of the bottom 90% of households has<br />
grown very little if at all in real terms. Practically all the growth in national income has gone<br />
to households at the very top of the income scale in the last 40 years - the top 10%, 1%,<br />
0.1%, and 0.01% of households seeing their real incomes rise twofold, threefold, fivefold<br />
and eightfold, respectively. The baseline assumption in the demand forecast is that median<br />
income will grow at 0.9% annually, about half the rate expected for average income. This<br />
scenario represents a slowing of the rate at which the distribution of income gets worse.<br />
The continuation of present trends with all income growth going to the top 10% and zero<br />
income growth for median households is the most pessimistic scenario in the uncertainty<br />
analysis. At the high end is the assumption that income grows proportionally across all<br />
households and the increasing skewness in the income distribution comes to a halt. Here,<br />
annual growth in average income equals that for median income equals 1.8%.<br />
Income Elasticity: As with price elasticity, the uncertainty band around income elasticity<br />
was derived from the various estimates of income elasticity in the literature review. A range<br />
of income elasticities from 0.19 to 0.35 (i.e., plus or minus 30%) around the mean value of<br />
0.27 was chosen.<br />
7 These percents were obtained by calculating the percent changes in 2060 water prices that would result from the<br />
high and low growth scenarios relative to the baseline scenario and multiplying them by the average price elasticity.<br />
FINAL Page 18 of 22 December 2011