

Projected Costs of Generating Electricity - OECD Nuclear Energy ...
Projected Costs of Generating Electricity - OECD Nuclear Energy ...
Projected Costs of Generating Electricity - OECD Nuclear Energy ...

Create successful ePaper yourself
Turn your PDF publications into a flip-book with our unique Google optimized e-Paper software.
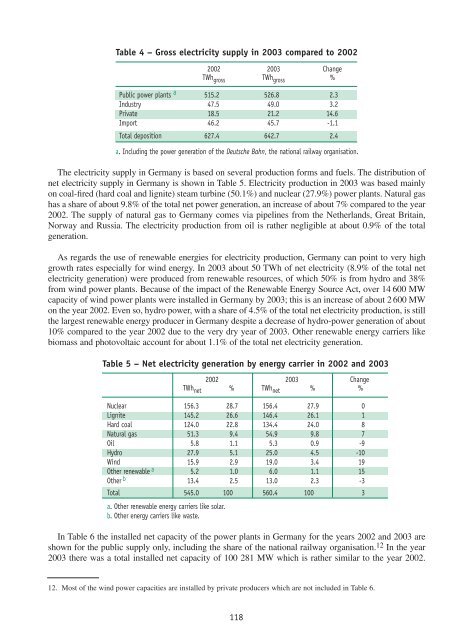
Table 4 – Gross electricity supply in 2003 compared to 2002<br />
2002 2003 Change<br />
TWh gross TWh gross %<br />
Public power plants a 515.2 526.8 2.3<br />
Industry 47.5 49.0 3.2<br />
Private 18.5 21.2 14.6<br />
Import 46.2 45.7 -1.1<br />
Total deposition 627.4 642.7 2.4<br />
a. Including the power generation <strong>of</strong> the Deutsche Bahn, the national railway organisation.<br />
The electricity supply in Germany is based on several production forms and fuels. The distribution <strong>of</strong><br />
net electricity supply in Germany is shown in Table 5. <strong>Electricity</strong> production in 2003 was based mainly<br />
on coal-fired (hard coal and lignite) steam turbine (50.1%) and nuclear (27.9%) power plants. Natural gas<br />
has a share <strong>of</strong> about 9.8% <strong>of</strong> the total net power generation, an increase <strong>of</strong> about 7% compared to the year<br />
2002. The supply <strong>of</strong> natural gas to Germany comes via pipelines from the Netherlands, Great Britain,<br />
Norway and Russia. The electricity production from oil is rather negligible at about 0.9% <strong>of</strong> the total<br />
generation.<br />
As regards the use <strong>of</strong> renewable energies for electricity production, Germany can point to very high<br />
growth rates especially for wind energy. In 2003 about 50 TWh <strong>of</strong> net electricity (8.9% <strong>of</strong> the total net<br />
electricity generation) were produced from renewable resources, <strong>of</strong> which 50% is from hydro and 38%<br />
from wind power plants. Because <strong>of</strong> the impact <strong>of</strong> the Renewable <strong>Energy</strong> Source Act, over 14 600 MW<br />
capacity <strong>of</strong> wind power plants were installed in Germany by 2003; this is an increase <strong>of</strong> about 2 600 MW<br />
on the year 2002. Even so, hydro power, with a share <strong>of</strong> 4.5% <strong>of</strong> the total net electricity production, is still<br />
the largest renewable energy producer in Germany despite a decrease <strong>of</strong> hydro-power generation <strong>of</strong> about<br />
10% compared to the year 2002 due to the very dry year <strong>of</strong> 2003. Other renewable energy carriers like<br />
biomass and photovoltaic account for about 1.1% <strong>of</strong> the total net electricity generation.<br />
Table 5 – Net electricity generation by energy carrier in 2002 and 2003<br />
2002 2003 Change<br />
TWh net % TWh net % %<br />
<strong>Nuclear</strong> 156.3 28.7 156.4 27.9 0<br />
Lignite 145.2 26.6 146.4 26.1 1<br />
Hard coal 124.0 22.8 134.4 24.0 8<br />
Natural gas 51.3 9.4 54.9 9.8 7<br />
Oil 5.8 1.1 5.3 0.9 -9<br />
Hydro 27.9 5.1 25.0 4.5 -10<br />
Wind 15.9 2.9 19.0 3.4 19<br />
Other renewable a 5.2 1.0 6.0 1.1 15<br />
Other b 13.4 2.5 13.0 2.3 -3<br />
Total 545.0 100 560.4 100 3<br />
a. Other renewable energy carriers like solar.<br />
b. Other energy carriers like waste.<br />
In Table 6 the installed net capacity <strong>of</strong> the power plants in Germany for the years 2002 and 2003 are<br />
shown for the public supply only, including the share <strong>of</strong> the national railway organisation. 12 In the year<br />
2003 there was a total installed net capacity <strong>of</strong> 100 281 MW which is rather similar to the year 2002.<br />
12. Most <strong>of</strong> the wind power capacities are installed by private producers which are not included in Table 6.<br />
118


