

Projected Costs of Generating Electricity - OECD Nuclear Energy ...
Projected Costs of Generating Electricity - OECD Nuclear Energy ...
Projected Costs of Generating Electricity - OECD Nuclear Energy ...

You also want an ePaper? Increase the reach of your titles
YUMPU automatically turns print PDFs into web optimized ePapers that Google loves.
Short-run marginal costs were calculated based on IEA data by adding fuel price and variable<br />
Operating and Maintenance costs for each type <strong>of</strong> plant.<br />
For the construction <strong>of</strong> our merit order, the case <strong>of</strong> the EU is taken as an illustration, considering the<br />
total installed capacity <strong>of</strong> the EU15. The purpose is to look at the potential magnitude <strong>of</strong> the effects, so<br />
details <strong>of</strong> the market operation have been ignored. 5 To analyse the effects <strong>of</strong> carbon emission allowances<br />
on the merit order, allowances at an assumed price <strong>of</strong> 20 €/tonne <strong>of</strong> CO 2 have been included. It is still<br />
very difficult to make price forecasts and even more so to foresee how prices may develop over time.<br />
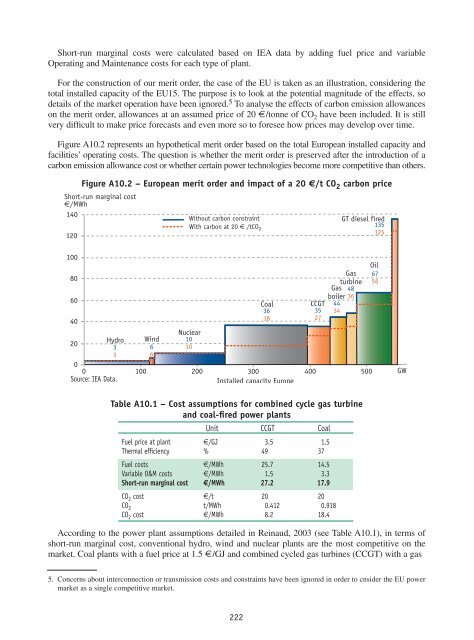
Figure A10.2 represents an hypothetical merit order based on the total European installed capacity and<br />
facilities’ operating costs. The question is whether the merit order is preserved after the introduction <strong>of</strong> a<br />
carbon emission allowance cost or whether certain power technologies become more competitive than others.<br />
Short-run marginal cost<br />
€/MWh<br />
140<br />
120<br />
Figure A10.2 – European merit order and impact <strong>of</strong> a 20 €/t CO 2 carbon price<br />
Without carbon constraint<br />
With carbon at 20 € /tCO 2<br />
GT diesel fired<br />
135<br />
125<br />
100<br />
Oil<br />
80<br />
Gas 67<br />
turbine 56<br />
Gas 48<br />
60<br />
boiler 36<br />
Coal CCGT 44<br />
36<br />
35 34<br />
40<br />
18<br />
27<br />
<strong>Nuclear</strong><br />
20<br />
Hydro Wind 10<br />
3 6 10<br />
3 6<br />
Source: IEA Data.<br />
Installed capacity Europe<br />
Table A10.1 – Cost assumptions for combined cycle gas turbine<br />
and coal-fired power plants<br />
Unit CCGT Coal<br />
Fuel price at plant €/GJ 3.5 1.5<br />
Thermal efficiency % 49 37<br />
Fuel costs €/MWh 25.7 14.5<br />
Variable O&M costs €/MWh 1.5 3.3<br />
Short-run marginal cost €/MWh 27.2 17.9<br />
CO 2 cost €/t 20 20<br />
CO 2 t/MWh 0.412 0.918<br />
CO 2 cost €/MWh 8.2 18.4<br />
500 GW<br />
According to the power plant assumptions detailed in Reinaud, 2003 (see Table A10.1), in terms <strong>of</strong><br />
short-run marginal cost, conventional hydro, wind and nuclear plants are the most competitive on the<br />
market. Coal plants with a fuel price at 1.5 €/GJ and combined cycled gas turbines (CCGT) with a gas<br />
5. Concerns about interconnection or transmission costs and constraints have been ignored in order to cnsider the EU power<br />
market as a single competitive market.<br />
222


