

Projected Costs of Generating Electricity - OECD Nuclear Energy ...
Projected Costs of Generating Electricity - OECD Nuclear Energy ...
Projected Costs of Generating Electricity - OECD Nuclear Energy ...

Create successful ePaper yourself
Turn your PDF publications into a flip-book with our unique Google optimized e-Paper software.
exchange rates, the coal prices vary by a factor <strong>of</strong> twenty between the Republic <strong>of</strong> South Africa, where<br />
the prices are the lowest at 0.1/0.15 USD/GJ, and more than 2 USD/GJ in many European countries and<br />
in Japan. Roughly half <strong>of</strong> the responses indicate price escalation during the economic lifetime <strong>of</strong> the plant<br />
while the other half indicates price stability. When prices are assumed to increase, escalation rates lead to<br />
an average increase <strong>of</strong> some 50% between 2010 and the end <strong>of</strong> the plant economic lifetime, i.e. 2050.<br />
Levelised generation costs<br />
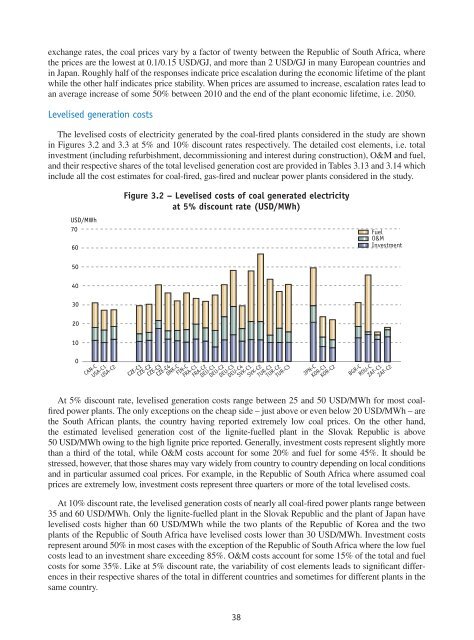
The levelised costs <strong>of</strong> electricity generated by the coal-fired plants considered in the study are shown<br />
in Figures 3.2 and 3.3 at 5% and 10% discount rates respectively. The detailed cost elements, i.e. total<br />
investment (including refurbishment, decommissioning and interest during construction), O&M and fuel,<br />
and their respective shares <strong>of</strong> the total levelised generation cost are provided in Tables 3.13 and 3.14 which<br />
include all the cost estimates for coal-fired, gas-fired and nuclear power plants considered in the study.<br />
USD/MWh<br />
70<br />
60<br />
Figure 3.2 – Levelised costs <strong>of</strong> coal generated electricity<br />
at 5% discount rate (USD/MWh)<br />
Fuel<br />
O&M<br />
Investment<br />
50<br />
40<br />
30<br />
20<br />
10<br />
0<br />
CAN-C<br />
USA-C1<br />
USA-C2<br />
CZE-C1<br />
CZE-C2<br />
CZE-C3<br />
CZE-C4<br />
DNK-C<br />
FIN-C<br />
FRA-C1<br />
FRA-C2<br />
DEU-C1<br />
DEU-C2<br />
DEU-C3<br />
DEU-C4<br />
SVK-C1<br />
SVK-C2<br />
TUR-C1<br />
TUR-C2<br />
TUR-C3<br />
JPN-C<br />
KOR-C1<br />
KOR-C2<br />
BGR-C<br />
ROU-C<br />
ZAF-C1<br />
ZAF-C2<br />
At 5% discount rate, levelised generation costs range between 25 and 50 USD/MWh for most coalfired<br />
power plants. The only exceptions on the cheap side – just above or even below 20 USD/MWh – are<br />
the South African plants, the country having reported extremely low coal prices. On the other hand,<br />
the estimated levelised generation cost <strong>of</strong> the lignite-fuelled plant in the Slovak Republic is above<br />
50 USD/MWh owing to the high lignite price reported. Generally, investment costs represent slightly more<br />
than a third <strong>of</strong> the total, while O&M costs account for some 20% and fuel for some 45%. It should be<br />
stressed, however, that those shares may vary widely from country to country depending on local conditions<br />
and in particular assumed coal prices. For example, in the Republic <strong>of</strong> South Africa where assumed coal<br />
prices are extremely low, investment costs represent three quarters or more <strong>of</strong> the total levelised costs.<br />
At 10% discount rate, the levelised generation costs <strong>of</strong> nearly all coal-fired power plants range between<br />
35 and 60 USD/MWh. Only the lignite-fuelled plant in the Slovak Republic and the plant <strong>of</strong> Japan have<br />
levelised costs higher than 60 USD/MWh while the two plants <strong>of</strong> the Republic <strong>of</strong> Korea and the two<br />
plants <strong>of</strong> the Republic <strong>of</strong> South Africa have levelised costs lower than 30 USD/MWh. Investment costs<br />
represent around 50% in most cases with the exception <strong>of</strong> the Republic <strong>of</strong> South Africa where the low fuel<br />
costs lead to an investment share exceeding 85%. O&M costs account for some 15% <strong>of</strong> the total and fuel<br />
costs for some 35%. Like at 5% discount rate, the variability <strong>of</strong> cost elements leads to significant differences<br />
in their respective shares <strong>of</strong> the total in different countries and sometimes for different plants in the<br />
same country.<br />
38


