- Page 1:
NUCLEAR ENERGY AGENCY INTERNATIONAL
- Page 4:
ORGANISATION FOR ECONOMIC CO-OPERAT
- Page 9 and 10:
Table of Contents Table of Contents
- Page 11:
Figures Figure 3.1 Specific overnig
- Page 14 and 15:
The introduction of liberalisation
- Page 16 and 17:
150 USD/MWh at a 5% discount rate a
- Page 18 and 19:
The technologies and plant types co
- Page 20 and 21:
locations and/or very favourable co
- Page 22 and 23:
conclusions of the study were used
- Page 25 and 26:
Chapter 2 Input Data and Cost Calcu
- Page 27 and 28:
equipped with emission control devi
- Page 29 and 30:
Table 2.2 - Exchange rates (as of 1
- Page 31 and 32:
Table 2.4 - Coal plant specificatio
- Page 33 and 34:
Table 2.7 - Wind and solar power pl
- Page 35:
Table 2.10 - Other plant specificat
- Page 38 and 39:
Figure 3.1 - Specific overnight con
- Page 40 and 41:
exchange rates, the coal prices var
- Page 42 and 43:
Construction time Gas-fired power p
- Page 44 and 45:
USD/MWh 70 60 Figure 3.5 - Levelise
- Page 46 and 47:
O&M costs The specific annual O&M c
- Page 48 and 49:
Cost ranges for coal, gas and nucle
- Page 50 and 51:
Ratio 1.9 Figure 3.12 - Cost ratios
- Page 52 and 53:
Table 3.11 - Overnight construction
- Page 54 and 55:
Table 3.14 - Projected generation c
- Page 56 and 57:
Except for the offshore plant in th
- Page 58 and 59:
At 10% discount rate, the levelised
- Page 60 and 61:
At 5% discount rate, hydroelectrici
- Page 62 and 63:
Table 4.4 - Overnight construction
- Page 64 and 65:
Table 4.6 - Projected generation co
- Page 66 and 67:
A CHP plant typically supplies heat
- Page 68 and 69:
Table 5.1 - Overnight construction
- Page 70 and 71:
Figure 5.2 - Levelised costs of ele
- Page 72 and 73:
lower unit capital and operating co
- Page 74 and 75:
Table 6.5 - Overnight construction
- Page 76 and 77:
cost calculation for some 130 power
- Page 78 and 79:
It should be stressed that the plan
- Page 80 and 81:
Concluding remarks The lowest level
- Page 82 and 83:
Portugal Mr. António B. Gomes EDP
- Page 84 and 85:
Table A2.1 - Nuclear plant investme
- Page 86 and 87:
Overnight Capital Costs: Constructi
- Page 88 and 89:
Table A2.7 - Gas-fired (including C
- Page 90 and 91:
Table A2.10 - Wind plant investment
- Page 92 and 93:
Overnight Capital Costs: Constructi
- Page 94 and 95:
Overnight Capital Costs: Constructi
- Page 96 and 97:
Cost structure of supported green e
- Page 98 and 99:
The highest investment cost arises
- Page 100 and 101:
The expected development of the per
- Page 102 and 103:
● ● Autoproducers. These firms
- Page 104 and 105:
Canada The electricity market situa
- Page 106 and 107:
Natural gas - combined cycle gas tu
- Page 108 and 109:
Denmark Basic data Denmark has abou
- Page 110 and 111:
In the future, both an increase in
- Page 112 and 113:
nuclear operator Teollisuuden Voima
- Page 114 and 115:
these power generation methods. Two
- Page 116 and 117:
Figure 5 - Competitiveness of vario
- Page 118 and 119:
2004. It envisages the gradual incr
- Page 120 and 121:
Table 4 - Gross electricity supply
- Page 122 and 123:
● ● ● ● ● ● ● ● ●
- Page 124 and 125:
Electricity generation costs The to
- Page 126 and 127:
photovoltaic device. Finally the su
- Page 128 and 129:
Table 1 - Installed electric power
- Page 130 and 131:
Japan Consumers in Japan are suppli
- Page 132 and 133:
BPE will be established not as a bi
- Page 134 and 135:
Coal Coal fired power plants have b
- Page 136 and 137:
A new sewage treatment plant with a
- Page 138 and 139: The interconnections between Portug
- Page 140 and 141: In order to respond to these basic
- Page 142 and 143: efficient energies and is reducing
- Page 144 and 145: Liberalisation Basic restructuring
- Page 146 and 147: External costs for electricity prod
- Page 148 and 149: At the beginning of plant operation
- Page 150 and 151: and high ash, moisture and sulphur
- Page 152 and 153: The White Paper did not contain pro
- Page 154 and 155: Table 7 shows the projected load fa
- Page 156 and 157: other investment options available
- Page 158 and 159: The impurities contained in coal ar
- Page 160 and 161: “ultra-supercritical” condition
- Page 162 and 163: unmineable coal seams. All three pr
- Page 164 and 165: Light water reactors require enrich
- Page 166 and 167: concerns. Consequently, the natural
- Page 168 and 169: generators and power electronics el
- Page 170 and 171: conventional fossil-fired plants. B
- Page 172 and 173: ● ● very effective and is used
- Page 175 and 176: Appendix 5 Cost Estimation Methodol
- Page 177: into account in the real price of g
- Page 180 and 181: ● ● ● ● Factors under the c
- Page 182 and 183: and small power plants. Although th
- Page 184 and 185: The general approach remains useful
- Page 186 and 187: Two US economic analyses of nuclear
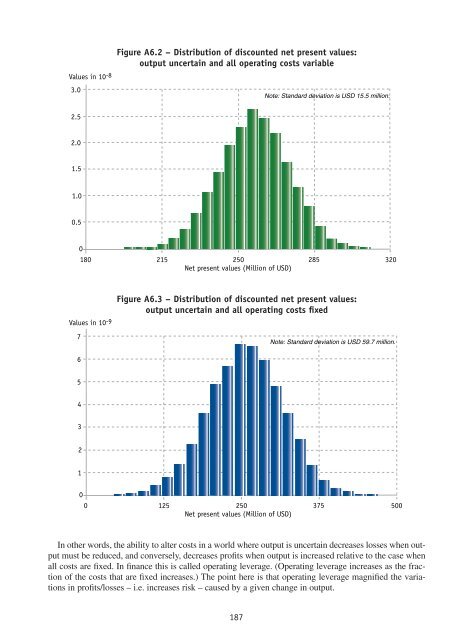
- Page 190 and 191: The effects of price risk on techno
- Page 192 and 193: The option to delay is embedded in
- Page 195 and 196: Appendix 7 Allocating the Costs and
- Page 197 and 198: Further Fourier’s law for heat tr
- Page 199 and 200: Figure A7.4 - The energy conversion
- Page 201 and 202: This yields: β = 0.153 α. If α e
- Page 203: It is emphasised that depending on
- Page 206 and 207: 1 st oil shock 2 nd oil shock Saudi
- Page 208 and 209: Table A8.2 - Expected lower and upp
- Page 210 and 211: Reliability in electricity systems
- Page 212 and 213: is also highly dependent on the typ
- Page 214 and 215: In the ILEX study 5 and in another
- Page 216 and 217: an increasing share of wind is the
- Page 218 and 219: able to work out the optimal operat
- Page 221 and 222: Appendix 10 Impact of Carbon Emissi
- Page 223 and 224: costs of generation. The introducti
- Page 225 and 226: price at 3.5 €/GJ are the next fa
- Page 227 and 228: Figure A10.5 - Steam coal price var
- Page 229 and 230: The longer term impact on investmen
- Page 231 and 232: Appendix 11 List of Main Abbreviati
- Page 233: OECD PUBLICATIONS, 2 rue André-Pas