

Projected Costs of Generating Electricity - OECD Nuclear Energy ...
Projected Costs of Generating Electricity - OECD Nuclear Energy ...
Projected Costs of Generating Electricity - OECD Nuclear Energy ...

You also want an ePaper? Increase the reach of your titles
YUMPU automatically turns print PDFs into web optimized ePapers that Google loves.
External costs for electricity production by different fuel cycles<br />
Fuel cycles Unit Coal and lignite Natural gas <strong>Nuclear</strong> Hydro<br />
Mean value <strong>of</strong> external costs given by<br />
implementation <strong>of</strong> ExternE Project <strong>of</strong> EU 15 €/MWh 40.8-73.3 12.5-23.3 3.9 3.8-4.8<br />
Adjusted external costs at currency rate<br />
<strong>of</strong> 41 SKK/Euro SKK/MWh 1 673-3 005 512-955 160 154-195<br />
Mean value included in study SKK/MWh 2 339 734 160 175<br />
The mean value <strong>of</strong> external costs for nuclear power stations is 160 SKK/MWh and is approximately<br />
on the level <strong>of</strong> renewables (hydro). For the power stations burning coal and lignite, the mean value <strong>of</strong><br />
2 339 SKK/MWh is nearly 15 times higher and that for natural gas is five times more than for nuclear<br />
power stations.<br />
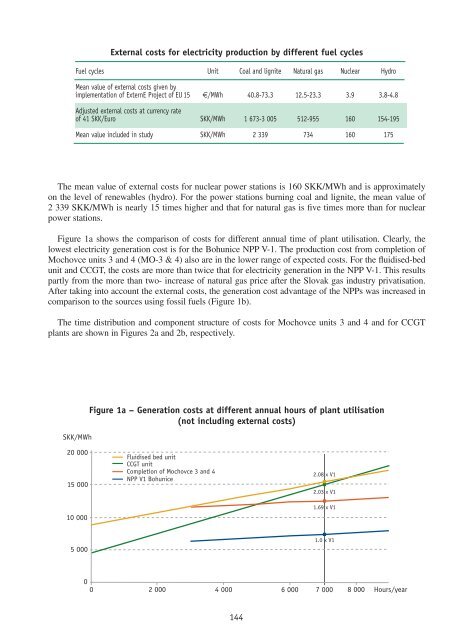
Figure 1a shows the comparison <strong>of</strong> costs for different annual time <strong>of</strong> plant utilisation. Clearly, the<br />
lowest electricity generation cost is for the Bohunice NPP V-1. The production cost from completion <strong>of</strong><br />
Mochovce units 3 and 4 (MO-3 & 4) also are in the lower range <strong>of</strong> expected costs. For the fluidised-bed<br />
unit and CCGT, the costs are more than twice that for electricity generation in the NPP V-1. This results<br />
partly from the more than two- increase <strong>of</strong> natural gas price after the Slovak gas industry privatisation.<br />
After taking into account the external costs, the generation cost advantage <strong>of</strong> the NPPs was increased in<br />
comparison to the sources using fossil fuels (Figure 1b).<br />
The time distribution and component structure <strong>of</strong> costs for Mochovce units 3 and 4 and for CCGT<br />
plants are shown in Figures 2a and 2b, respectively.<br />
SKK/MWh<br />
Figure 1a – Generation costs at different annual hours <strong>of</strong> plant utilisation<br />
(not including external costs)<br />
20 000<br />
15 000<br />
10 000<br />
CCGT unit<br />
Fluidised bed unit<br />
Completion <strong>of</strong> Mochovce 3 and 4<br />
NPP V1 Bohunice<br />
2.08 x V1<br />
2.03 x V1<br />
1.69 x V1<br />
5 000<br />
1.0 x V1<br />
0<br />
0 2 000<br />
4 000 6 000<br />
7 000 8 000 Hours/year<br />
144


