HVO 2009 Annual Environmental Management Report - Final
HVO 2009 Annual Environmental Management Report - Final
HVO 2009 Annual Environmental Management Report - Final

You also want an ePaper? Increase the reach of your titles
YUMPU automatically turns print PDFs into web optimized ePapers that Google loves.
Coal & Allied – Hunter Valley Operations<br />
Table 34: Ground Water Results from <strong>HVO</strong> Carrington Groundwater’s for <strong>2009</strong><br />
Location<br />
EC (S/cm)<br />
Average Min Max Average Min Max<br />
pH<br />
CGW39 7,897 6,720 8,450 7.4 7.0 8.0<br />
CGW45 NA NA NA NA NA NA<br />
CGW46 NA NA NA NA NA NA<br />
CGW49 3,647 3,130 4,210 7.5 7.2 8.1<br />
CGW51A 11,185 6,980 12,450 7.2 7.1 7.4<br />
CGW52 5,350 2,450 6,370 7.2 7.1 7.3<br />
CGW52A 3,887 2,960 4,470 7.6 7.3 7.9<br />
CGW54A 6,337 3,500 8,410 7.4 7.3 7.5<br />
CGW6 2,050 1,800 2,420 7.5 7.1 8.6<br />
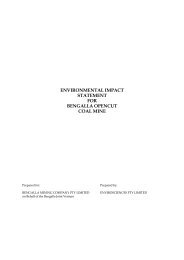
Groundwater Monitoring pH Results for Carrington Piezometers<br />
Recorded pH levels remained within a 7.0 to 8.6 range (Figure 45). Please refer to ‘Interpretation of<br />
Groundwater Monitoring Results for Carrington Piezometers’ below.<br />
9<br />
Carrington Groundwater pH Trends<br />
8.5<br />
8<br />
pH (pH Units)<br />
7.5<br />
7<br />
6.5<br />
Jan 09<br />
Feb 09<br />
Mar 09<br />
Apr 09<br />
May 09<br />
Jun 09<br />
Jul 09 Aug 09<br />
Date<br />
Sep 09<br />
Oct 09<br />
Nov 09<br />
Dec 09<br />
Jan 10<br />
CGW39 CGW45 CGW46 CGW49 CGW51A CGW52 CGW52A CGW54A<br />
CGW6<br />
Figure 45: Carrington Groundwater pH Trends<br />
AEMR <strong>2009</strong> 96