HVO 2009 Annual Environmental Management Report - Final
HVO 2009 Annual Environmental Management Report - Final
HVO 2009 Annual Environmental Management Report - Final

You also want an ePaper? Increase the reach of your titles
YUMPU automatically turns print PDFs into web optimized ePapers that Google loves.
Coal & Allied – Hunter Valley Operations<br />
Table 37: Groundwater Results from Alluvial Lands Levee Bank Groundwater for <strong>2009</strong><br />
Location<br />
EC (S/cm)<br />
Average Min Max Average Min Max<br />
pH<br />
PZ1CH200 2,055 1,210 2,620 7.0 6.9 7.2<br />
PZ2CH400 1,818 930 2,850 7.1 6.9 7.4<br />
PZ3CH800 733 500 860 7.3 7.2 7.6<br />
PZ4CH1380 1,095 630 2,170 7.3 6.9 7.9<br />
PZ5CH1800 253 200 310 7.6 7.1 8.1<br />
PZ6CH2450 615 570 690 7.4 7.0 7.8<br />
HV3 788 640 890 7.5 7.3 7.8<br />
HV4 NA NA NA NA NA NA<br />
GA3 715 670 760 7.2 7.0 7.3<br />
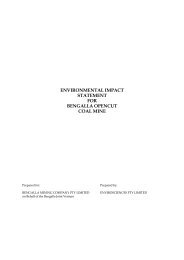
Groundwater Monitoring pH Results for Alluvial Lands Levee Bank Piezometers<br />
Observed pH levels remained relatively stable throughout <strong>2009</strong> between values 6.9 and 8.1 (Figure 54). A<br />
slight increase across all sites was observed during December sampling.<br />
9<br />
Alluvial Lands Levee Bank Groundwater pH Trends<br />
8.5<br />
8<br />
pH(pH units)<br />
7.5<br />
7<br />
6.5<br />
6<br />
Jan 09<br />
Feb 09<br />
Mar 09<br />
Apr 09<br />
May 09<br />
Jun 09<br />
Jul 09<br />
Date<br />
Aug 09<br />
Sep 09<br />
Oct 09<br />
Nov 09<br />
Dec 09<br />
PZ1CH200 PZ2CH400 PZ3CH800 PZ4CH1380 PZ4CH1800 PZ5CH2450 GA3<br />
HV3<br />
Figure 54: Alluvial Levee Bank Groundwater pH Trends<br />
AEMR <strong>2009</strong> 105