HVO 2009 Annual Environmental Management Report - Final
HVO 2009 Annual Environmental Management Report - Final
HVO 2009 Annual Environmental Management Report - Final

Create successful ePaper yourself
Turn your PDF publications into a flip-book with our unique Google optimized e-Paper software.
Coal & Allied – Hunter Valley Operations<br />
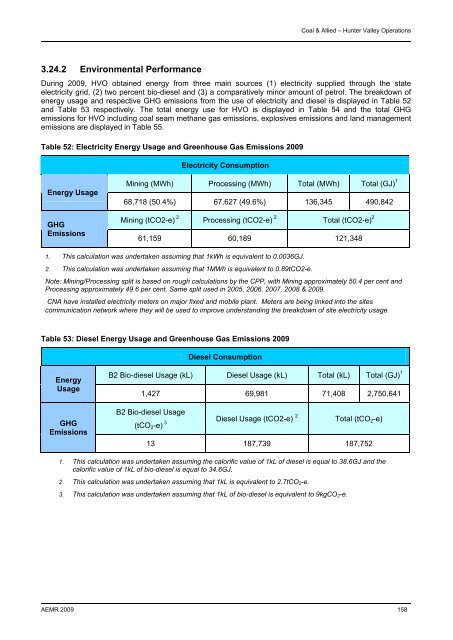
3.24.2 <strong>Environmental</strong> Performance<br />
During <strong>2009</strong>, <strong>HVO</strong> obtained energy from three main sources (1) electricity supplied through the state<br />
electricity grid, (2) two percent bio-diesel and (3) a comparatively minor amount of petrol. The breakdown of<br />
energy usage and respective GHG emissions from the use of electricity and diesel is displayed in Table 52<br />
and Table 53 respectively. The total energy use for <strong>HVO</strong> is displayed in Table 54 and the total GHG<br />
emissions for <strong>HVO</strong> including coal seam methane gas emissions, explosives emissions and land management<br />
emissions are displayed in Table 55.<br />
Table 52: Electricity Energy Usage and Greenhouse Gas Emissions <strong>2009</strong><br />
Electricity Consumption<br />
Energy Usage<br />
GHG<br />
Emissions<br />
Mining (MWh) Processing (MWh) Total (MWh) Total (GJ) 1<br />
68,718 (50.4%) 67,627 (49.6%) 136,345 490,842<br />
Mining (tCO2-e) 2 Processing (tCO2-e) 2 Total (tCO2-e) 2<br />
61,159 60,189 121,348<br />
1. This calculation was undertaken assuming that 1kWh is equivalent to 0.0036GJ.<br />
2. This calculation was undertaken assuming that 1MWh is equivalent to 0.89tCO2-e.<br />
Note: Mining/Processing split is based on rough calculations by the CPP, with Mining approximately 50.4 per cent and<br />
Processing approximately 49.6 per cent. Same split used in 2005, 2006, 2007, 2008 & <strong>2009</strong>.<br />
CNA have installed electricity meters on major fixed and mobile plant. Meters are being linked into the sites<br />
communication network where they will be used to improve understanding the breakdown of site electricity usage.<br />
Table 53: Diesel Energy Usage and Greenhouse Gas Emissions <strong>2009</strong><br />
Diesel Consumption<br />
Energy<br />
Usage<br />
GHG<br />
Emissions<br />
B2 Bio-diesel Usage (kL) Diesel Usage (kL) Total (kL) Total (GJ) 1<br />
1,427 69,981 71,408 2,750,641<br />
B2 Bio-diesel Usage<br />
(tCO 2 -e) 3 Diesel Usage (tCO2-e) 2 Total (tCO 2 -e)<br />
13 187,739 187,752<br />
1. This calculation was undertaken assuming the calorific value of 1kL of diesel is equal to 38.6GJ and the<br />
calorific value of 1kL of bio-diesel is equal to 34.6GJ.<br />
2. This calculation was undertaken assuming that 1kL is equivalent to 2.7tCO 2 -e.<br />
3. This calculation was undertaken assuming that 1kL of bio-diesel is equivalent to 9kgCO 2 -e.<br />
AEMR <strong>2009</strong> 158