HVO 2009 Annual Environmental Management Report - Final
HVO 2009 Annual Environmental Management Report - Final
HVO 2009 Annual Environmental Management Report - Final

Create successful ePaper yourself
Turn your PDF publications into a flip-book with our unique Google optimized e-Paper software.
Coal & Allied – Hunter Valley Operations<br />
Location<br />
EC (S/cm)<br />
Average Min Max Average Min Max<br />
pH<br />
BZ8-3 1,610 - - 6.6 - -<br />
HG1 4,213 4,130 4,270 7.5 7.3 7.9<br />
HG2 4,258 4,190 4,360 7.4 7.2 7.8<br />
HG2A 2,790 2,760 2,830 7.4 7.3 7.8<br />
HG3 2,733 2,670 2,780 7.3 7.2 7.3<br />
Table 39: Groundwater Results from Cheshunt Stage 2 Groundwater’s for <strong>2009</strong><br />
Location<br />
EC (uS/cm)<br />
Average Min Max Average Min Max<br />
pH<br />
BUNC44D 1,875 1,130 2,540 6.4 6.3 6.5<br />
BUNC46D 1,313 1,070 1,750 6.9 4.6 7.9<br />
CHPZ12A 870 690 940 7.1 6.7 7.4<br />
CHPZ12D 1,455 1,430 1,480 10.7 10.4 11.1<br />
CHPZ13A 840 710 890 7.1 6.8 7.4<br />
CHPZ13D 720 630 780 9.9 8.9 10.8<br />
CHPZ14A 678 580 760 7.3 6.8 7.9<br />
CHPZ14D 648 530 710 10.2 8.5 10.9<br />
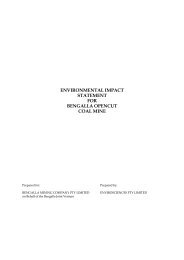
Groundwater Monitoring pH Results for Cheshunt Stage 1 Piezometers<br />
Observed pH levels remained relatively stable throughout <strong>2009</strong> between values 6.5 and 8.1 (Figure 57).<br />
Recorded pH across the monitored sites is within normal historical ranges. A noticeable increase trend is<br />
experienced by bores in December sampling. It is unclear pending further sampling whether this is the<br />
beginning of an increasing trend or a function of temporal conditions at the time of sampling.<br />
AEMR <strong>2009</strong> 109