HVO 2009 Annual Environmental Management Report - Final
HVO 2009 Annual Environmental Management Report - Final
HVO 2009 Annual Environmental Management Report - Final

Create successful ePaper yourself
Turn your PDF publications into a flip-book with our unique Google optimized e-Paper software.
Coal & Allied – Hunter Valley Operations<br />
0<br />
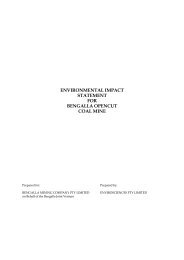
Carrington Groundwater SWL Trends<br />
5<br />
10<br />
Standing Water Level (m)<br />
15<br />
20<br />
25<br />
30<br />
Jan 09<br />
Feb 09<br />
Mar 09<br />
Apr 09<br />
May 09<br />
Jun 09<br />
Jul 09 Aug 09<br />
Date<br />
Sep 09<br />
Oct 09<br />
Nov 09<br />
Dec 09<br />
Jan 10<br />
CGW39 CGW45 CGW46 CGW49 CGW51A CGW52 CGW52A CGW54A CGW6<br />
Figure 47: Carrington Groundwater SWL Trends<br />
Interpretation of Groundwater Monitoring Results for Carrington Piezometers<br />
CGW6<br />
CGW6 is located in alluvium near the Hunter River, just upstream of Carrington.<br />
The mean pH at CGW6 was 7.5 in <strong>2009</strong>. A spike in pH values was noted from CGW6 (pH 8.6) occurring in<br />
September <strong>2009</strong>, however this spike was consistent with bores in the vicinity and within historical ranges for<br />
groundwater located in this alluvium area.<br />
CGW6 EC levels averaged 2,050μS/cm for the <strong>2009</strong> reporting period. This value is closely aligned with<br />
historical data. The average EC value is slightly increased on the 2008 reported average (1,700μS/cm) and<br />
represents the return to normal conditions for the aquifer in the vicinity of this piezometer following the dilution<br />
caused by the large flood of June 2007.<br />
Water levels at CGW6 were recorded at an average depth of 9.45m (60.0m AHD) through <strong>2009</strong>.<br />
CGW39<br />
Samples for pH and EC analysis from CGW39 were only available during the last quarter of 2008. CGW39<br />
was reported as dry with depths of around 13m (65.04m AHD) over the past three years. However water<br />
levels and samples were able to be collected following purging of the bore in September 2008. It is therefore<br />
difficult to establish trends based on the data available.<br />
The <strong>2009</strong> reporting period represents the first consistent year for data collection from this site.<br />
The mean pH at CGW39 was 7.4 in <strong>2009</strong>. A spike in pH values was noted from CGW39 (pH 8.0) in<br />
September <strong>2009</strong>, however this spike was consistent with bores in the vicinity and within historical ranges for<br />
groundwater located in this alluvium area.<br />
CGW39 EC levels averaged 7,897μS/cm for the <strong>2009</strong> reporting period. Consistent data and minimal<br />
fluctuation around for EC and SWL support that the bore is functioning within normal limits.<br />
Water levels at CGW39 where measured at an average depth of 11.08m (65.5m AHD) through <strong>2009</strong>.<br />
AEMR <strong>2009</strong> 98