HVO 2009 Annual Environmental Management Report - Final
HVO 2009 Annual Environmental Management Report - Final
HVO 2009 Annual Environmental Management Report - Final

You also want an ePaper? Increase the reach of your titles
YUMPU automatically turns print PDFs into web optimized ePapers that Google loves.
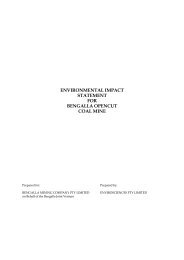
Coal & Allied – Hunter Valley Operations<br />
Groundwater Monitoring EC Results for Alluvial Lands Levee Bank Piezometers<br />
The EC levels in all of the monitored bores remained relatively low during the monitoring period (Figure 55).<br />
Some fluctuations were witnessed in PZ1CH200, PZ2CH400 and PZ4CH1380 however these differences are<br />
likely to be specific response to large volumes of out sourced water pumped in a purge and case cleaning that<br />
occurred on 24 July <strong>2009</strong>. The highest average EC level was 2,055μS/cm at PZ1CH200 and the lowest<br />
average reading of 253μS/cm belonged to PZ5CH1800.<br />
3,000<br />
Alluvial Lands Levee Bank Groundwater EC Trends<br />
2,500<br />
Electrical Conductivity (uS/cm)<br />
2,000<br />
1,500<br />
1,000<br />
500<br />
0<br />
Jan 09<br />
Feb 09<br />
Mar 09<br />
Apr 09<br />
May 09<br />
Jun 09<br />
Jul 09<br />
Date<br />
Aug 09<br />
Sep 09<br />
Oct 09<br />
Nov 09<br />
Dec 09<br />
PZ1CH200 PZ2CH400 PZ3CH800 PZ4CH1380 PZ5CH1800 PZ6CH2450 GA3<br />
HV3<br />
Figure 55: Alluvial Levee Bank Groundwater EC Trends<br />
Groundwater Monitoring SWL Results for Alluvial Lands Levee Bank Piezometers<br />
Monitored SWL remained largely consistent throughout the year except for a noticeable decline in SWL at<br />
PZ2CH400 (Figure 56). The trend in PZ2CH400 water level is responding to a purge and case cleaning that<br />
occurred on 24 July <strong>2009</strong>. Levee monitoring data indicates a stable water table adjacent to the levee, with no<br />
indication of potential seepage issues with the cut-off wall beneath the levee.<br />
AEMR <strong>2009</strong> 106