HVO 2009 Annual Environmental Management Report - Final
HVO 2009 Annual Environmental Management Report - Final
HVO 2009 Annual Environmental Management Report - Final

You also want an ePaper? Increase the reach of your titles
YUMPU automatically turns print PDFs into web optimized ePapers that Google loves.
Coal & Allied – Hunter Valley Operations<br />
TSP Short Term Assessment<br />
No short term (24 hour) impact assessment criteria applies to HVAS TSP monitors.<br />
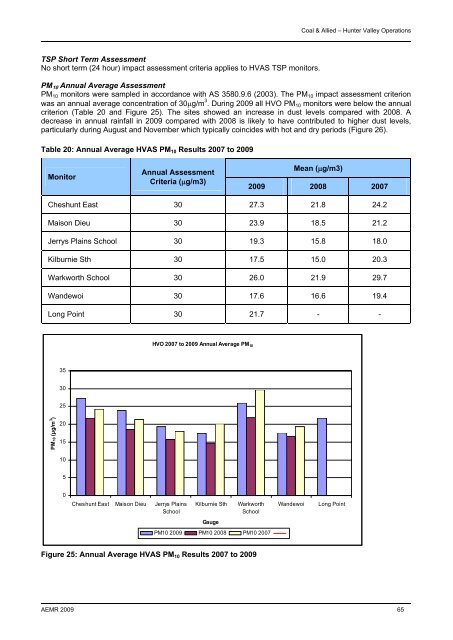
PM 10 <strong>Annual</strong> Average Assessment<br />
PM 10 monitors were sampled in accordance with AS 3580.9.6 (2003). The PM 10 impact assessment criterion<br />
was an annual average concentration of 30g/m 3 . During <strong>2009</strong> all <strong>HVO</strong> PM 10 monitors were below the annual<br />
criterion (Table 20 and Figure 25). The sites showed an increase in dust levels compared with 2008. A<br />
decrease in annual rainfall in <strong>2009</strong> compared with 2008 is likely to have contributed to higher dust levels,<br />
particularly during August and November which typically coincides with hot and dry periods (Figure 26).<br />
Table 20: <strong>Annual</strong> Average HVAS PM 10 Results 2007 to <strong>2009</strong><br />
Monitor<br />
<strong>Annual</strong> Assessment<br />
Criteria (g/m3)<br />
Mean (g/m3)<br />
<strong>2009</strong> 2008 2007<br />
Cheshunt East 30 27.3 21.8 24.2<br />
Maison Dieu 30 23.9 18.5 21.2<br />
Jerrys Plains School 30 19.3 15.8 18.0<br />
Kilburnie Sth 30 17.5 15.0 20.3<br />
Warkworth School 30 26.0 21.9 29.7<br />
Wandewoi 30 17.6 16.6 19.4<br />
Long Point 30 21.7 - -<br />
<strong>HVO</strong> 2007 to <strong>2009</strong> <strong>Annual</strong> Average PM 10<br />
35<br />
30<br />
25<br />
PM10 (μg/m 3 )<br />
20<br />
15<br />
10<br />
5<br />
0<br />
Cheshunt East Maison Dieu Jerrys Plains<br />
School<br />
Kilburnie Sth<br />
Warkworth<br />
School<br />
Wandewoi<br />
Long Point<br />
Gauge<br />
PM10 <strong>2009</strong> PM10 2008 PM10 2007<br />
Figure 25: <strong>Annual</strong> Average HVAS PM 10 Results 2007 to <strong>2009</strong><br />
AEMR <strong>2009</strong> 65