HVO 2009 Annual Environmental Management Report - Final
HVO 2009 Annual Environmental Management Report - Final
HVO 2009 Annual Environmental Management Report - Final

You also want an ePaper? Increase the reach of your titles
YUMPU automatically turns print PDFs into web optimized ePapers that Google loves.
Coal & Allied – Hunter Valley Operations<br />
CGW54<br />
CGW54 is located in the Broonie 1 coal seam. CGW54 is no longer monitored due to a bent casing and<br />
blockage. Samples for pH and EC analysis from CGW54 were only available during the last quarter of 2008. It<br />
is therefore difficult to establish trends based on the data available.<br />
CGW54A<br />
The pH at CGW54A remained in an average range around 7.4 in <strong>2009</strong>. This value is consistent with historical<br />
data that since 2006 suggest pH values between 6.8 and 7.7.<br />
CGW54A EC levels fluctuated around an average EC value of 6,337μS/cm for the <strong>2009</strong> reporting period. A<br />
significant drop in EC was observed between the March and July monitoring period, from a maximum<br />
recorded EC of 8410μS/cm to the yearly low of 3500μS/cm. Following this sample, the September and<br />
December monitoring results show a returning trend to normal EC conditions.<br />
Water levels at CGW54A where recorded at an average depth of 10.6m (57.8m AHD) through <strong>2009</strong>.<br />
North Pit and Alluvial Lands Groundwater<br />
With mining and rehabilitation completed at North Pit, monitoring of restored alluvial with a series of<br />
piezometers and bores DM1 to DM6 commenced in 2004 to establish water levels and quality located on the<br />
mined side of the levee bank.<br />
Sampling is undertaken quarterly subject to safe access. DM5 and DM6 were unable to be sampled in <strong>2009</strong><br />
due to bore damage. Samples for analysis of EC were not collected for site DM1 with no free water present.<br />
Monitoring results for <strong>2009</strong> are shown in Table 35 and Figure 48 to Figure 50.<br />
Table 35: Groundwater Results from North Pit & Alluvial Lands for <strong>2009</strong><br />
Location<br />
EC (S/cm)<br />
Average Min Max Average Min Max<br />
pH<br />
DM1 (Weir 1 Piezo) NA NA NA NA NA NA<br />
DM2 (Weir 2 Piezo) 10,253 10,000 10,500 6.6 6.5 6.9<br />
DM3 8,325 8,180 8,630 6.9 6.7 7.2<br />
DM4 4,833 4,540 5,130 7.7 7.7 7.8<br />
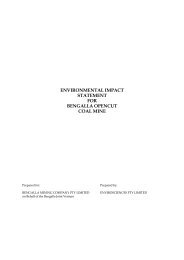
Groundwater Monitoring pH Results for North Pit and Alluvial Lands Piezometers<br />
Recorded pH values in <strong>2009</strong> remain within historical values of 6.5 and 8.0 pH units (Figure 48).<br />
AEMR <strong>2009</strong> 100