HVO 2009 Annual Environmental Management Report - Final
HVO 2009 Annual Environmental Management Report - Final
HVO 2009 Annual Environmental Management Report - Final

You also want an ePaper? Increase the reach of your titles
YUMPU automatically turns print PDFs into web optimized ePapers that Google loves.
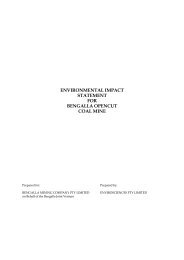
Coal & Allied – Hunter Valley Operations<br />
Groundwater Monitoring EC Results for New Cheshunt Stage 2 Piezometers<br />
All EC results with the exception of BUNC44D appear to have stabilised (Figure 61). The EC in the stable<br />
bores likely shows EC directly influenced by the Hunter River. More historical data is required for accurate<br />
assessment of trends.<br />
3,000<br />
Cheshunt Stage 2 Groundwaters EC Trend<br />
2,500<br />
Electrical Conductivity (uS/cm)<br />
2,000<br />
1,500<br />
1,000<br />
500<br />
0<br />
Jan 09<br />
Feb 09<br />
Mar 09<br />
Apr 09<br />
May 09<br />
Jun 09<br />
Jul 09<br />
Date<br />
Aug 09<br />
Sep 09<br />
Oct 09<br />
Nov 09<br />
Dec 09<br />
BUNC44D BUNC46D CHPZ12A CHPZ12D CHPZ13A CHPZ13D CHPZ14A CHPZ14D<br />
Figure 61: Cheshunt Stage 2 Groundwater EC Trends<br />
Groundwater Monitoring SWL Results for Cheshunt Stage 2 Piezometers<br />
All SWL results with the exception of BUNC46D appear to have stabilised, showing minor fluctuations likely<br />
associated with water levels in the Hunter River (Figure 62). More historical data is required for accurate<br />
assessment of trends.<br />
0<br />
Cheshunt Stage 2 Groundwater SWL Trends<br />
2<br />
4<br />
Standing Water Level (m)<br />
6<br />
8<br />
10<br />
12<br />
14<br />
Jan 09<br />
Feb 09<br />
Mar 09<br />
Apr 09<br />
May 09<br />
Jun 09<br />
Date<br />
Jul 09<br />
Aug 09<br />
Sep 09<br />
Oct 09<br />
Nov 09<br />
Dec 09<br />
BUNC44D BUNC46D CHPZ12A CHPZ12D CHPZ13A CHPZ13D CHPZ14A CHPZ14D<br />
Figure 62: Cheshunt Stage 2 Groundwater SWL Trends<br />
AEMR <strong>2009</strong> 112