HVO 2009 Annual Environmental Management Report - Final
HVO 2009 Annual Environmental Management Report - Final
HVO 2009 Annual Environmental Management Report - Final

You also want an ePaper? Increase the reach of your titles
YUMPU automatically turns print PDFs into web optimized ePapers that Google loves.
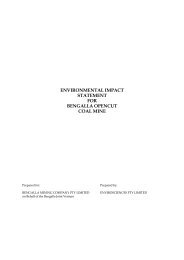
Coal & Allied – Hunter Valley Operations<br />
8.5<br />
Cheshunt Stage 1 Groundwater pH Trends<br />
8<br />
7.5<br />
pH(pH units)<br />
7<br />
6.5<br />
6<br />
Jan 09<br />
Feb 09<br />
Mar 09<br />
Apr 09<br />
May 09<br />
Jun 09<br />
Jul 09 Aug 09<br />
Date<br />
Sep 09<br />
Oct 09<br />
Nov 09<br />
Dec 09<br />
Jan 10<br />
BC1A BZ1-1 BZ1-2 BZ1-3 BZ3-1 BZ3-2 BZ3-3 BZ4A(1) BZ4A(2)<br />
BZ8-2 HG1 HG2 HG2A HG3<br />
Figure 57: Cheshunt Stage 1 Groundwater pH Trends<br />
Groundwater Monitoring EC Results for Cheshunt Stage One Piezometers<br />
The highest average EC reading of 14,120μS/cm was recorded at BZ4A(1) with the lowest average EC<br />
reading of 920μS/cm. Other EC levels remained stable (Figure 58).<br />
The EC levels at BZ1-1 (sandstone/interburden) trended upwards in 2008 from 4,710μS/cm at the end of<br />
2007, and then levelled off at an average level of 8,232μS/cm in 2008. In <strong>2009</strong> the EC dropped significantly<br />
from 9,000μS/cm to 2,800μS/cm in June and September, before returning to a maximum of 11,300μS/cm.<br />
The cause of this variation remains unknown and the site will continue to be monitored in 2010.<br />
The EC levels for BZ3-2 indicate a substantial increasing trend from 500μS/cm in June 2007 to 5,520μS/cm in<br />
December 2008. Following a small return to 2460μS/cm in March <strong>2009</strong>, an increasing trend, peaking at<br />
6780μS/cm, was observed at the end of the <strong>2009</strong> reporting period.<br />
15,000<br />
Cheshunt Stage 1 Groundwater EC Trends<br />
14,000<br />
13,000<br />
12,000<br />
11,000<br />
Electrical Conductivity (uS/cm)<br />
10,000<br />
9,000<br />
8,000<br />
7,000<br />
6,000<br />
5,000<br />
4,000<br />
3,000<br />
2,000<br />
1,000<br />
0<br />
Jan 09<br />
Feb 09 Mar 09<br />
Apr 09<br />
May 09<br />
Jun 09<br />
Jul 09 Aug 09<br />
Date<br />
Sep 09<br />
Oct 09<br />
Nov 09<br />
Dec 09<br />
Jan 10<br />
BC1A BZ1-1 BZ1-2 BZ1-3 BZ3-1 BZ3-2 BZ3-3 BZ4A(1) BZ4A(2)<br />
BZ8-2 HG1 HG2 HG2A HG3<br />
Figure 58: Cheshunt Stage 1 Groundwater EC Trends<br />
AEMR <strong>2009</strong> 110