HVO 2009 Annual Environmental Management Report - Final
HVO 2009 Annual Environmental Management Report - Final
HVO 2009 Annual Environmental Management Report - Final

Create successful ePaper yourself
Turn your PDF publications into a flip-book with our unique Google optimized e-Paper software.
Coal & Allied – Hunter Valley Operations<br />
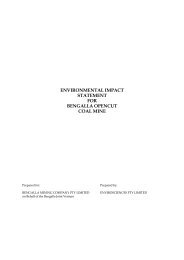
Groundwater Monitoring EC Results for Lemington Piezometers<br />
The EC levels across all monitored bores remained stable. A slight increase in EC levels recorded at<br />
GW9710 from 12,730μS/cm in March 2008 to 13,500μS/cm in September <strong>2009</strong>. This potential trend will<br />
continue to be monitored in 2010. The highest recorded average EC level of 13,500μS/cm was taken from<br />
GW9710 with the lowest average EC level of 3600μS/cm taken from GWAR981.<br />
14,000<br />
Lemington Groundwater EC Trends<br />
12,000<br />
10,000<br />
Electrical Conductivity (uS/cm)<br />
8,000<br />
6,000<br />
4,000<br />
2,000<br />
0<br />
Jan 09<br />
Feb 09<br />
Mar 09<br />
Apr 09<br />
May 09<br />
Jun 09<br />
Jul 09<br />
Date<br />
Aug 09<br />
Sep 09<br />
Oct 09<br />
Nov 09<br />
Dec 09<br />
C1(WJ039) F1.5(WF533) GW9701 GW9702 GW9710 GWAR981<br />
Figure 64: Lemington Groundwater EC Trends<br />
Groundwater Monitoring SWL Results for Lemington Piezometers<br />
All SWL results remained stable during <strong>2009</strong> with a slight increase to GW9701 and GW9702.<br />
0<br />
Lemington Groundwater SWL Trends<br />
5<br />
10<br />
Standing Water Level (m)<br />
15<br />
20<br />
25<br />
30<br />
35<br />
40<br />
Jan 09<br />
Feb 09<br />
Mar 09<br />
Apr 09<br />
May 09<br />
Jun 09<br />
Jul 09<br />
Date<br />
Aug 09<br />
Sep 09<br />
Oct 09<br />
Nov 09<br />
Dec 09<br />
C1(WJ039) F1.5(WF533) GW9701 GW9702 GW9710 GWAR981<br />
Figure 65: Lemington Groundwater SWL<br />
AEMR <strong>2009</strong> 114