- Page 1 and 2:
TM Methods in Molecular Biology Vol
- Page 3 and 4:
Xin Wang and W. Scott Young III 105
- Page 5 and 6:
63. Primed In Situ Nucleic Acid Lab
- Page 7 and 8:
4 Bartlett and Stirling The thing t
- Page 9 and 10:
6 Bartlett and Stirling Fig. 2. Res
- Page 11 and 12:
8 Carroll and Casimir of PCR. Such
- Page 13 and 14:
10 Carroll and Casimir cost more th
- Page 15 and 16:
12 Carroll and Casimir are no longe
- Page 17 and 18:
14 Carroll and Casimir Should these
- Page 19 and 20:
16 McDonagh Fig. 1. Unidirectional
- Page 21 and 22:
18 McDonagh stored. This means that
- Page 23 and 24:
20 McDonagh
- Page 25 and 26:
22 Stirling which will either not a
- Page 27 and 28:
24 Stirling
- Page 29 and 30:
28 Bartlett References 1. US Depart
- Page 31 and 32:
30 Bartlett and White 11. 5 M sodiu
- Page 33 and 34:
32 Bartlett and White
- Page 35 and 36:
34 Pearson and Stirling 11. Microfu
- Page 37 and 38:
36 Going 3. Methods 3.1. Section Cu
- Page 39 and 40:
38 Going pipet filler. Spread the p
- Page 41 and 42:
40 Going digitally to record the di
- Page 43 and 44:
42 Going
- Page 45 and 46:
44 Pearson 7. Add 60 µL of chlorof
- Page 47 and 48:
46 Bartlett 3. Methods 3.1. RNA Ext
- Page 49 and 50:
48 Pearson 3. Method The method of
- Page 51 and 52:
50 Stirling and Bartlett 4. Protein
- Page 53 and 54:
52 Stirling and Bartlett
- Page 55 and 56:
54 Stirling 3. Methods 3.1. Fungal
- Page 57 and 58:
56 McDonagh 2. Add 0.4 mL of TNE bu
- Page 59 and 60:
58 Schmerer 2. Materials To apply t
- Page 61 and 62:
60 Schmerer 3. The additional purif
- Page 63 and 64:
62 Schmerer
- Page 65 and 66:
64 Stirling
- Page 67 and 68:
66 Bartlett Table 1 Recommended Aga
- Page 69 and 70:
68 Bartlett Table 2 Separation of D
- Page 71 and 72:
70 Bartlett 2. 5× TBE: 54 g of Tri
- Page 73 and 74:
72 Bartlett 7. Remove upper aqueous
- Page 75 and 76:
74 Bartlett 4. Many modern electrop
- Page 77 and 78:
76 Bartlett
- Page 79 and 80:
78 Stirling 11. Store at -20°C for
- Page 81 and 82:
82 Hyndman and Mitsuhashi 3.1. Effi
- Page 83 and 84:
84 Hyndman and Mitsuhashi Fig. 1. H
- Page 85 and 86:
86 Hyndman and Mitsuhashi Fig. 3. H
- Page 87 and 88:
88 Hyndman and Mitsuhashi can be ge
- Page 89 and 90:
90 Grunenwald may be affected by ea
- Page 91 and 92:
92 Grunenwald 50°C will generally
- Page 93 and 94:
94 Grunenwald of template DNA, a su
- Page 95 and 96:
96 Grunenwald than absolutely neces
- Page 97 and 98:
98 Grunenwald 2. Foord, O. S. and R
- Page 99 and 100:
100 Grunenwald
- Page 101 and 102:
102 Stirling Table 1 Thermal Cycler
- Page 103 and 104:
104 Stirling
- Page 105 and 106:
106 Wang and Young full-length cDNA
- Page 107 and 108:
108 Wang and Young Fig. 1. (A) Nort
- Page 109 and 110:
110 Wang and Young Fig. 3. Expresse
- Page 111 and 112:
112 Wang and Young 2. First-strand
- Page 113 and 114:
114 Wang and Young 3′-RACE outlin
- Page 115 and 116:
116 Wang and Young
- Page 117 and 118:
118 Dassanayake and Samaranayake co
- Page 119 and 120:
120 Dassanayake and Samaranayake 5.
- Page 121 and 122:
122 Dassanayake and Samaranayake Re
- Page 123 and 124:
124 Iannone et al. Fig. 1. Diagram
- Page 125 and 126:
Table 1 Oligonucleotides Descriptio
- Page 127 and 128:
128 Iannone et al. 5. For microsphe
- Page 129 and 130:
130 Iannone et al. 4. To adjust for
- Page 131 and 132:
132 Iannone et al. 6. Target concen
- Page 133 and 134:
134 Iannone et al.
- Page 135 and 136:
136 Benjamin, Smith, and Waites amp
- Page 137 and 138:
138 Benjamin, Smith, and Waites the
- Page 139 and 140:
140 Benjamin, Smith, and Waites 2.2
- Page 141 and 142:
142 Benjamin, Smith, and Waites 2.
- Page 143 and 144:
144 Benjamin, Smith, and Waites 3.3
- Page 145 and 146:
146 Benjamin, Smith, and Waites 3.3
- Page 147 and 148:
148 Benjamin, Smith, and Waites 8.
- Page 149 and 150:
150 Benjamin, Smith, and Waites
- Page 151 and 152:
152 Olmos et al. Fig. 1. RT-hemines
- Page 153 and 154:
154 Olmos et al. This nested RT-PCR
- Page 155 and 156:
156 Olmos et al. Table 2 Volume and
- Page 157 and 158:
158 Olmos et al. 8. The sensitivity
- Page 159 and 160:
160 Olmos et al.
- Page 161 and 162:
162 Abe 5. Moloney murine leukemia
- Page 163 and 164:
164 Abe Table 2 Detection Rate of H
- Page 165 and 166:
166 Abe 4. For HBV, nested PCR usin
- Page 167 and 168:
168 Tellier et al. of Pfu (and ther
- Page 169 and 170:
170 Tellier et al. 2. Cline, J., Br
- Page 171 and 172:
172 Tellier et al. 38. Tamiya, S.,
- Page 173 and 174:
174 Tellier et al. 13. Thin-wall PC
- Page 175 and 176:
176 Tellier et al. 13 min for the l
- Page 177 and 178:
178 Tellier et al.
- Page 179 and 180:
182 Stirling efficiency of the reac
- Page 181 and 182:
184 Stirling
- Page 183 and 184:
186 Cremer and Moos Fig. 1. Rearran
- Page 185 and 186:
188 Cremer and Moos 4. Count cells
- Page 187 and 188:
190 Cremer and Moos Fig. 3. Alignme
- Page 189 and 190:
192 Cremer and Moos Fig. 4. Testing
- Page 191 and 192:
194 Cremer and Moos 5. Compare the
- Page 193 and 194:
196 Cremer and Moos 11. Klein, E.,
- Page 195 and 196:
198 McDonagh the dilution method is
- Page 197 and 198:
200 McDonagh 2.2. Basic PCR 1. dNTP
- Page 199 and 200:
202 McDonagh Fig. 2. Quantitative P
- Page 201 and 202:
204 McDonagh
- Page 203 and 204:
206 Bartlett Table 1 Example Assay
- Page 205 and 206:
208 Bartlett 3.4. Calculation of Re
- Page 207 and 208:
210 Bartlett 11. Cerenkov counting
- Page 209 and 210:
212 Kerr Fig. 1. Fluorescent probes
- Page 211 and 212:
214 Kerr after the PCR. This reduce
- Page 213 and 214:
218 Bartlett As with any experiment
- Page 215 and 216:
220 Bartlett Even once novel regula
- Page 217 and 218:
222 Bartlett Notwithstanding these
- Page 219 and 220:
224 Bartlett
- Page 221 and 222:
226 Dominguez et al. Table 1 Primer
- Page 223 and 224:
228 Dominguez et al. 4. Oligonucleo
- Page 225 and 226:
230 Dominguez et al. Fig. 2. cDNA n
- Page 227 and 228:
232 Dominguez et al. 3.4. Gel Elect
- Page 229 and 230:
234 Dominguez et al. 3. If the cont
- Page 231 and 232:
236 Dominguez et al. 11. Joshi, C.
- Page 233 and 234:
238 Khalturin, Kuznetsov, and Bosch
- Page 235 and 236:
240 Khalturin, Kuznetsov, and Bosch
- Page 237 and 238:
242 Khalturin, Kuznetsov, and Bosch
- Page 239 and 240:
244 Khalturin, Kuznetsov, and Bosch
- Page 241 and 242:
246 Ringquist et al. In this chapte
- Page 243 and 244:
248 Ringquist et al. 5. Total RNA s
- Page 245 and 246:
250 Ringquist et al. 3. Purificatio
- Page 247 and 248:
252 Ringquist et al. 2. The present
- Page 249 and 250: 254 Ringquist et al.
- Page 251 and 252: 256 Case-Green, Pritchard, and Sout
- Page 253 and 254: 258 Case-Green, Pritchard, and Sout
- Page 255 and 256: 260 Case-Green, Pritchard, and Sout
- Page 257 and 258: 262 Case-Green, Pritchard, and Sout
- Page 259 and 260: 264 Case-Green, Pritchard, and Sout
- Page 261 and 262: 266 Case-Green, Pritchard, and Sout
- Page 263 and 264: 268 Case-Green, Pritchard, and Sout
- Page 265 and 266: 270 Case-Green, Pritchard, and Sout
- Page 267 and 268: 272 Oien Fig. 1. A schematic diagra
- Page 269 and 270: 274 Oien 4. 100% and 70% ethanol. 5
- Page 271 and 272: 276 Oien 2. Purify polyA + mRNA fro
- Page 273 and 274: 278 Oien 50-mL conical tubes. Resus
- Page 275 and 276: 280 Oien Forward Primer, and then r
- Page 277 and 278: 282 Oien 8. PCR. With SAGE, achievi
- Page 279 and 280: 284 Oien
- Page 281 and 282: 288 Edwards and Bartlett technology
- Page 283 and 284: 290 Edwards and Bartlett ing less p
- Page 285 and 286: 292 Edwards and Bartlett Stepwise m
- Page 287 and 288: 294 Edwards and Bartlett
- Page 289 and 290: 296 Rithidech and Dunn 11. Ethidium
- Page 291 and 292: 298 Rithidech and Dunn Fig. 1. PCR
- Page 293 and 294: 300 Rithidech and Dunn
- Page 295 and 296: 302 Edwards and Bartlett Studies th
- Page 297 and 298: 304 Edwards and Bartlett 11. Hot st
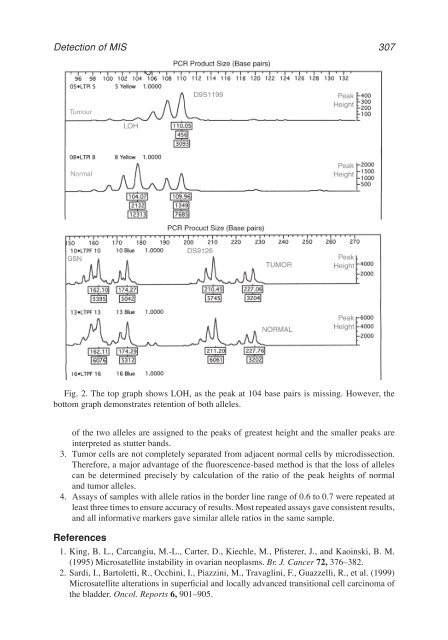
- Page 299: 306 Edwards and Bartlett Fig. 1. Ex
- Page 303 and 304: 310 Schmerer the investigation conc
- Page 305 and 306: 312 Schmerer References 1. Kunkel,
- Page 307 and 308: 314 Schmerer
- Page 309 and 310: 316 Aubele and Smida 2.2. Chemicals
- Page 311 and 312: 318 Aubele and Smida References 1.
- Page 313 and 314: 320 Nakashima, Akahoshi, and Tanaka
- Page 315 and 316: 322 Nakashima, Akahoshi, and Tanaka
- Page 317 and 318: 324 Stirling 9. TAE (20×): 484 g o
- Page 319 and 320: 326 Stirling
- Page 321 and 322: 328 Han and Robinson Fig. 1. Basic
- Page 323 and 324: 330 Han and Robinson sequence diffe
- Page 325 and 326: 332 Han and Robinson 4. Notes 1. PC
- Page 327 and 328: 334 Han and Robinson
- Page 329 and 330: 338 Stirling of simple and improved
- Page 331 and 332: 340 Stirling concentrations interfe
- Page 333 and 334: 342 Daniels to sequence a 500-bp PC
- Page 335 and 336: 344 Daniels 4. Load all of the samp
- Page 337 and 338: 346 Daniels References 1. Orita, M.
- Page 339 and 340: 348 Kösel et al. Fig. 1. Schematic
- Page 341 and 342: 350 Kösel et al. 3. Methods 3.1. P
- Page 343 and 344: 352 Kösel et al. Fig. 2. Sequencin
- Page 345 and 346: 354 Kösel et al. 5. Kwok, S. and H
- Page 347 and 348: 356 Mazars and Theillet Fig. 1. Sch
- Page 349 and 350: 358 Mazars and Theillet of genomic
- Page 351 and 352:
360 Mazars and Theillet
- Page 353 and 354:
362 Suomalainen and Syvänen Fig. 1
- Page 355 and 356:
364 Suomalainen and Syvänen detect
- Page 357 and 358:
366 Suomalainen and Syvänen temper
- Page 359 and 360:
368 Shen et al. ladder. Also, direc
- Page 361 and 362:
370 Shen et al. 3. Mineral oil. 4.
- Page 363 and 364:
372 Shen et al. extended primers, w
- Page 365 and 366:
374 Quivy and Becker Fig. 1. The us
- Page 367 and 368:
376 Quivy and Becker that decreases
- Page 369 and 370:
378 Quivy and Becker 2. Solution of
- Page 371 and 372:
380 Quivy and Becker 7. Precipitate
- Page 373 and 374:
382 Quivy and Becker 7. Prepare a p
- Page 375 and 376:
384 Quivy and Becker
- Page 377 and 378:
386 Walsh by most, but not all M13
- Page 379 and 380:
388 Walsh PCR products are now flus
- Page 381 and 382:
390 Walsh 5. For palindromic restri
- Page 383 and 384:
392 Walsh
- Page 385 and 386:
394 McAleer, Coffey, and Dunham Fig
- Page 387 and 388:
396 McAleer, Coffey, and Dunham Tab
- Page 389 and 390:
398 McAleer, Coffey, and Dunham Tab
- Page 391 and 392:
400 McAleer, Coffey, and Dunham
- Page 393 and 394:
402 Stirling 5. Homopolymer Regions
- Page 395 and 396:
406 Speel, Ramaekers, and Hopman Ta
- Page 397 and 398:
408 Speel, Ramaekers, and Hopman Fi
- Page 399 and 400:
410 Speel, Ramaekers, and Hopman po
- Page 401 and 402:
Table 2 Comparison of PRINS, in Sit
- Page 403 and 404:
414 Speel, Ramaekers, and Hopman te
- Page 405 and 406:
Table 3 Summary of Control Experime
- Page 407 and 408:
418 Speel, Ramaekers, and Hopman 3.
- Page 409 and 410:
420 Speel, Ramaekers, and Hopman ad
- Page 411 and 412:
422 Speel, Ramaekers, and Hopman 25
- Page 413 and 414:
424 Speel, Ramaekers, and Hopman 63
- Page 415 and 416:
426 Bull and Paskins Fig. 1. Result
- Page 417 and 418:
428 Bull and Paskins 2.3. Detection
- Page 419 and 420:
430 Bull and Paskins 6. Shake the s
- Page 421 and 422:
432 Bull and Paskins
- Page 423 and 424:
434 Wiedorn and Goldmann Fig. 1. IS
- Page 425 and 426:
436 Wiedorn and Goldmann 41. Protei
- Page 427 and 428:
438 Wiedorn and Goldmann 2. Incubat
- Page 429 and 430:
440 Wiedorn and Goldmann 3.15. Prim
- Page 431 and 432:
442 Wiedorn and Goldmann ficient se
- Page 433 and 434:
444 Wiedorn and Goldmann 25. Kommin
- Page 435 and 436:
446 Gilchrist and Befus Fig. 1. Sch
- Page 437 and 438:
448 Gilchrist and Befus 2. Cells ar
- Page 439 and 440:
450 Gilchrist and Befus Fig. 3. RT
- Page 441 and 442:
452 Gilchrist and Befus References
- Page 443 and 444:
454 Speel, Ramaekers, and Hopman of
- Page 445 and 446:
456 Speel, Ramaekers, and Hopman Fi
- Page 447 and 448:
458 Speel, Ramaekers, and Hopman 3.
- Page 449 and 450:
460 Speel, Ramaekers, and Hopman 4.
- Page 451 and 452:
462 Speel, Ramaekers, and Hopman bu
- Page 453 and 454:
464 Speel, Ramaekers, and Hopman 26
- Page 455 and 456:
468 Pearson and Stirling into PCR p
- Page 457 and 458:
470 Wang 2. Materials 2.1. PCR 1. D
- Page 459 and 460:
472 Wang Fig. 1. A brief outline of
- Page 461 and 462:
474 Wang
- Page 463 and 464:
476 Horton, Raju, and Conti-Fine Fi
- Page 465 and 466:
478 Horton, Raju, and Conti-Fine th
- Page 467 and 468:
480 Horton, Raju, and Conti-Fine 1.
- Page 469 and 470:
482 Horton, Raju, and Conti-Fine ot
- Page 471 and 472:
484 Horton, Raju, and Conti-Fine
- Page 473 and 474:
486 Preston amplification approach
- Page 475 and 476:
488 Preston 1. 10× PCR buffer: 100
- Page 477 and 478:
490 Preston Fig. 1. Design of degen
- Page 479 and 480:
492 Preston 2. Remove the AmpliTaq
- Page 481 and 482:
494 Preston 3.3. Cloning and DNA Se
- Page 483 and 484:
496 Preston MgCl 2 concentrations b
- Page 485 and 486:
498 Preston 21. Hung, T., Mak, K.,
- Page 487 and 488:
500 Ravassard et al. Fig. 1. Constr
- Page 489 and 490:
502 Ravassard et al. size dispersio
- Page 491 and 492:
504 Ravassard et al. 9. ddH 2 O. 10
- Page 493 and 494:
506 Ravassard et al. 3.2.2. RNA Mix
- Page 495 and 496:
508 Ravassard et al. 4. Wash twice
- Page 497 and 498:
510 Ravassard et al.
- Page 499 and 500:
512 Pont-Kingdon Fig. 1. Constructi
- Page 501 and 502:
514 Pont-Kingdon 9. Invert tube and
- Page 503 and 504:
516 Pont-Kingdon
- Page 505 and 506:
518 Jones and Winistorfer Fig. 1. D
- Page 507 and 508:
520 Jones and Winistorfer Fig. 2. D
- Page 509 and 510:
522 Jones and Winistorfer The yield
- Page 511 and 512:
524 Jones and Winistorfer 7. Goulde
- Page 513 and 514:
526 Burke and Barik Fig. 1. The bas
- Page 515 and 516:
528 Burke and Barik concentration o
- Page 517 and 518:
530 Burke and Barik purified mutant
- Page 519:
532 Burke and Barik


