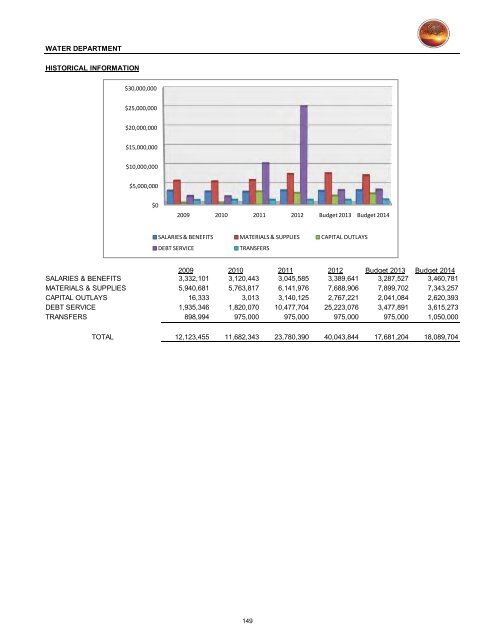
WATER DEPARTMENT HISTORICAL INFORMATION $30,000,000 $25,000,000 $20,000,000 $15,000,000 $10,000,000 $5,000,000 $0 2009 2010 2011 2012 <strong>Budget</strong> <strong>2013</strong> <strong>Budget</strong> 20<strong>14</strong> SALARIES & BENEFITS MATERIALS & SUPPLIES CAPITAL OUTLAYS DEBT SERVICE TRANSFERS 2009 2010 2011 2012 <strong>Budget</strong> <strong>2013</strong> <strong>Budget</strong> 20<strong>14</strong> SALARIES & BENEFITS 3,332,101 3,120,443 3,045,585 3,389,641 3,287,527 3,460,781 MATERIALS & SUPPLIES 5,940,681 5,763,817 6,<strong>14</strong>1,976 7,688,906 7,899,702 7,343,257 CAPITAL OUTLAYS 16,333 3,013 3,<strong>14</strong>0,125 2,767,221 2,041,084 2,620,393 DEBT SERVICE 1,935,346 1,820,070 10,477,704 25,223,076 3,477,891 3,615,273 TRANSFERS 898,994 975,000 975,000 975,000 975,000 1,050,000 TOTAL 12,123,455 11,682,343 23,780,390 40,043,844 17,681,204 18,089,704 <strong>14</strong>9
Revenue <strong>Budget</strong> <strong>2013</strong>-<strong>14</strong> <strong>City</strong> <strong>of</strong> <strong>St</strong>. <strong>George</strong> 51 WATER UTILITY 20<strong>14</strong> 20<strong>14</strong> Account Number Actuals 7-Month Actuals 2012 <strong>2013</strong> <strong>2013</strong> <strong>2013</strong> <strong>2013</strong> Dept. <strong>City</strong> Manager 5-Mo. Estimate 12-Mo. Estimate <strong>Budget</strong> Request <strong>Recommended</strong> 3310 FEDERAL GRANTS 34,326 <strong>14</strong>,369 10,264 24,633 31,000 25,000 25,000 3340 STATE GRANTS 0 0 0 0 0 0 0 3610 INTEREST EARNINGS 9,376 6,403 4,574 10,977 10,000 10,000 10,000 3620 RENTS AND ROYALTIES 1,324,688 710,792 507,708 1,218,500 557,200 1,190,875 1,190,875 3640 SALE OF PROPERTY 0 0 0 0 0 0 0 3670 SALE OF BONDS 21,345,000 0 3,561,087 3,561,087 0 0 0 3690 MISCELLANEOUS SUNDRY REVENUES 0 22,155 15,825 37,980 0 0 0 3700 TAP WATER REVENUES 13,645,521 10,085,903 5,4<strong>14</strong>,097 15,500,000 <strong>14</strong>,070,000 15,500,000 15,500,000 3710 CITY WATER RENTAL FEES 4,609 0 0 0 0 0 0 3711 PENALTIES 77,821 57,616 41,154 98,770 70,000 85,000 85,000 3713 CONNECTION FEES 111,851 26,935 19,239 46,174 165,000 50,000 50,000 37<strong>14</strong> GAIN ON BOND REDEMPTION 0 0 0 0 0 0 0 3715 LOSS ON BOND REFINANCING 0 0 0 0 0 0 0 3719 SANTA CLARA - SNOW CANYON LINE 170,056 101,165 0 101,165 0 100,000 100,000 3720 IVINS - SNOW CANYON LINE 206,248 21,327 238,673 260,000 60,000 250,000 250,000 3757 SERVICE ACCOUNT - LABOR 124,224 103,446 0 103,446 50,000 75,000 75,000 3763 PROPERTY SALES 6,172 13,045 0 13,045 0 0 0 3810 CONTRIBUTIONS FROM OTHERS 0 0 0 0 0 0 0 3820 XFRS FROM OTHER FUNDS (IMPACT FEES) 793,830 491,008 350,720 841,728 500,000 750,000 750,000 3820 XFRS FROM OTHER FUNDS (REPL. AIRPORT) 1,000,000 500,000 0 500,000 500,000 0 0 3820 XFRS FROM OTHER FUNDS (CDBG PROJECT) 0 0 0 0 0 0 3880 APPROPRIATED FUND BALANCE 0 0 0 0 0 0 Total Revenues 38,853,722 12,154,164 10,163,341 22,317,505 16,013,200 18,035,875 18,035,875 Total Expenses (does not include depreciation) 40,043,844 10,136,470 9,656,705 19,793,175 17,681,204 18,102,541 18,021,860 Total Revenues Over(Under) Expenses -1,190,122 2,017,694 506,636 2,524,330 -1,668,004 -66,666 <strong>14</strong>,015 150