

Comprehensive Annual Financial Report - City of Santa Monica
Comprehensive Annual Financial Report - City of Santa Monica
Comprehensive Annual Financial Report - City of Santa Monica

Create successful ePaper yourself
Turn your PDF publications into a flip-book with our unique Google optimized e-Paper software.
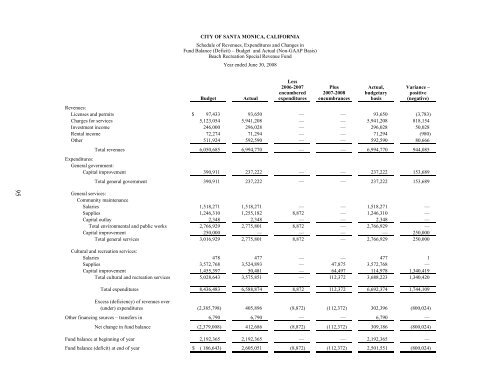
CITY OF SANTA MONICA, CALIFORNIA<br />
Schedule <strong>of</strong> Revenues, Expenditures and Changes in<br />
Fund Balance (Deficit) – Budget and Actual (Non-GAAP Basis)<br />
Beach Recreation Special Revenue Fund<br />
Year ended June 30, 2008<br />
Less<br />
2006-2007 Plus Actual, Variance –<br />
encumbered 2007-2008 budgetary positive<br />
Budget Actual expenditures encumbrances basis (negative)<br />
Revenues:<br />
Licenses and permits $ 97,433<br />
93,650 — — 93,650 (3,783)<br />
Charges for services 5,123,054 5,941,208 — — 5,941,208 818,154<br />
Investment income 246,000 296,028 — — 296,028 50,028<br />
Rental income 72,274 71,294 — — 71,294 (980)<br />
Other 511,924 592,590 — — 592,590 80,666<br />
Total revenues 6,050,685 6,994,770 — — 6,994,770 944,085<br />
Expenditures:<br />
General government:<br />
Capital improvement 390,911 237,222 — — 237,222 153,689<br />
Ttl Total general government 390,911911 237,222222 — — 237,222222 153,689<br />
95<br />
General services:<br />
Community maintenance<br />
Salaries 1,518,271 1,518,271 — — 1,518,271 —<br />
Supplies 1,246,310 1,255,182 8,872 — 1,246,310 —<br />
Capital outlay 2,348 2,348 — — 2,348 —<br />
Total environmental and public works 2,766,929 2,775,801 8,872 — 2,766,929 —<br />
Capital improvement 250,000 — — — — 250,000<br />
Total general services 3,016,929 2,775,801 8,872 — 2,766,929 250,000<br />
Cultural and recreation services:<br />
Salaries 478 477 — — 477 1<br />
Supplies 3,572,768 3,524,893 — 47,875 3,572,768 —<br />
Capital improvement 1,455,397 50,481 — 64,497 114,978 1,340,419<br />
Total cultural and recreation services 5,028,643 3,575,851 — 112,372 3,688,223 1,340,420<br />
Total expenditures 8,436,483 6,588,874 8,872 112,372 6,692,374 1,744,109<br />
Excess (deficiency) <strong>of</strong> revenues over<br />
(under) expenditures (2,385,798) 405,896 (8,872) (112,372) 302,396 (800,024)<br />
Other financing sources – transfers in 6,790 6,790 — — 6,790 —<br />
Net change in fund balance (2,379,008) 412,686 (8,872) (112,372) 309,186 (800,024)<br />
Fund balance at beginning <strong>of</strong> year 2,192,365 2,192,365 — — 2,192,365 —<br />
Fund balance (deficit) at end <strong>of</strong> year $ ( 186,643) 2,605,051 (8,872) (112,372) 2,501,551 (800,024)


