CITY OF SANTA MONICA, CALIFORNIA Changes in Net Assets Last Five Fiscal Years TABLE 2 2007-08 2006-07 2005-06 2004-05 2003-04 Expenses Governmental activities: General government $ 38,849,626 45,323,227 31,288,910 33,648,946 12,218,726 Public safety 91,862,403 87,830,433 82,886,707 80,300,625 74,489,887 General services 111,168,586 41,404,237 64,777,602 32,961,058 30,659,648 Cultural and recreation services 33,776,210 43,646,843 40,022,151 35,163,220 36,958,290 Library 11,458,259 10,681,518 7,974,534 7,849,658 20,241,923 Housing and community development 91,966,369 74,988,387 56,708,298 52,223,052 64,079,218 Other (1) — 469,285 2,212,186 1,273,607 244,438 Interest on long term debt 7,628,437 7,934,428 7,514,924 9,507,522 8,430,126 Total governmental activities 386,709,890 312,278,358 293,385,312 252,927,688 247,322,256 Business-type activities: Water 15,489,230 14,830,595 13,855,863 17,564,916 16,382,688 Solid waste management 16,277,710 18,630,141 17,459,310 16,550,895 15,933,665 Pier 4,867,415 9,485,709 7,544,001 6,922,305 8,079,003 Wastewater 20,063,420 19,579,035 19,008,944 14,755,836 14,013,170 Civic auditorium 3,718,652 3,535,624 2,898,853 3,129,521 2,741,857 Airport 5,199,701 5,325,190 3,882,639 3,845,108 3,845,116 Storm water management 474,683 502,183 648,374 966,897 403,294 Cemetery 1,715,605 1,481,238 989,274 1,243,343 1,137,698 Big Blue Bus 65,185,007 59,627,736 59,180,481 52,021,645 47,265,202 Cable communications (2) — — — 1,340,120 932,823 Special aviation 18,333 69,374 52,329 52,329 52,329 Parking authority 349,576 709,982 16,189 202,794 337,552 Total business-type activities 133,359,332 133,776,807 125,536,257 118,595,709 111,124,397 Total primary governmental activities expenses 520,069,222 446,055,165 418,921,569 371,523,397 358,446,653 Program revenues Governmental activities: Charges for services: General government 17,188,876 17,326,675 12,567,222 10,854,382 7,005,002 Public safety 17,298,741 17,202,256 15,754,085 15,840,756 15,671,730 General services 19,650,237 18,841,288 17,880,336 15,776,086 15,105,283 Cultural and recreation services 9,492,174 9,002,084 8,556,557 8,147,054 (3) 7,842,184 Library 363,987 349,139 232,025 173,864 178,555 Housing and community development 14,430,326 13,925,980 12,553,269 12,193,457 13,478,114 Operating grants and contributions 34,803,655 28,362,525 25,133,124 26,063,799 31,705,184 Capital grants and contributions 4,862,387 4,839,925 5,838,885 612,985 1,500,466 Total governmental activities program revenues 118,090,383 109,849,872 98,515,503 89,662,383 92,486,518 Business-type activities: Charges for services: Water 16,130,044 15,323,653 13,868,390 13,113,058 13,110,498 Solid waste management 18,842,702 18,766,107 17,097,813 15,704,667 14,598,362 Pier 3,107,349 3,081,338 2,693,200 2,717,162 2,563,783 Wastewater 12,797,786 12,472,073 11,175,051 11,376,456 11,004,692 Civic auditorium 3,117,033 2,789,196 2,608,759 2,474,609 2,279,508 Airport 4,279,268 3,992,190 3,862,455 3,706,719 3,527,460 Storm water management 1,301,350 1,376,672 1,610,715 1,439,149 1,355,903 Cemetery 1,080,532 735,718 665,398 650,484 445,327 Big Blue Bus 13,898,980 13,078,630 13,333,584 11,298,250 12,190,925 Cable communications (2) — — — 798,984 747,063 Parking authority 145,600 141,600 138,100 1,612,705 1,457,952 (continues next page) 136
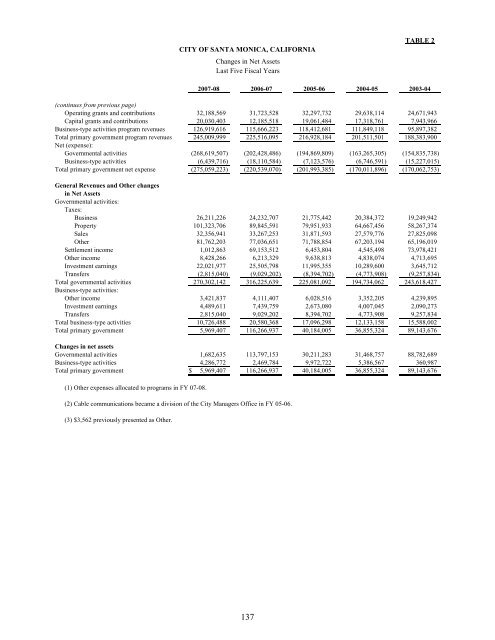
CITY OF SANTA MONICA, CALIFORNIA Changes in Net Assets Last Five Fiscal Years TABLE 2 2007-08 2006-07 2005-06 2004-05 2003-04 (continues from previous page) Operating grants and contributions 32,188,569 31,723,528 32,297,732 29,638,114 24,671,943 Capital grants and contributions 20,030,403 12,185,518 19,061,484 17,318,761 7,943,966 Business-type activities program revenues 126,919,616 115,666,223 118,412,681 111,849,118 95,897,382 Total primary government program revenues 245,009,999 225,516,095 216,928,184 201,511,501 188,383,900 Net (expense): Governmental activities (268,619,507) (202,428,486) (194,869,809) (163,265,305) (154,835,738) Business-type activities (6,439,716) (18,110,584) (7,123,576) (6,746,591) (15,227,015) Total primary government net expense (275,059,223) (220,539,070) (201,993,385) (170,011,896) (170,062,753) General Revenues and Other changes in Net Assets Governmental activities: Taxes: Business 26,211,226 24,232,707 21,775,442 20,384,372 19,249,942 Property 101,323,706 89,845,591 79,951,933 64,667,456 58,267,374 Sales 32,356,941 33,267,253 31,871,593 27,579,776 27,825,098 Other 81,762,203 77,036,651 71,788,854 67,203,194 65,196,019 Settlement income 1,012,863 69,153,512 6,453,804 4,545,498 73,978,421 Other income 8,428,266 6,213,329 9,638,813 4,838,074 4,713,695 Investment earnings 22,021,977 25,505,798 11,995,355 10,289,600 3,645,712 Transfers (2,815,040) (9,029,202) (8,394,702) (4,773,908) (9,257,834) Total governmental activities 270,302,142 316,225,639 225,081,092 194,734,062 243,618,427 Business-type activities: Other income 3,421,837 4,111,407 6,028,516 3,352,205 4,239,895 Investment earnings 4,489,611 7,439,759 2,673,080 4,007,045 2,090,273 Transfers 2,815,040 9,029,202 8,394,702 4,773,908 9,257,834 Total business-type activities 10,726,488 20,580,368 17,096,298 12,133,158 15,588,002 Total primary government 5,969,407 116,266,937 40,184,005 36,855,324 89,143,676 Changes in net assets Governmental activities 1,682,635 113,797,153 30,211,283 31,468,757 88,782,689 Business-type activities 4,286,772 2,469,784 9,972,722 5,386,567 360,987 Total primary government $ 5,969,407 116,266,937 40,184,005 36,855,324 89,143,676 (1) Other expenses allocated to programs in FY 07-08. (2) Cable communications became a division <strong>of</strong> the <strong>City</strong> Managers Office in FY 05-06. (3) $3,562 previously presented as Other. 137
- Page 1 and 2:
City of Santa Monica Comprehensive
- Page 3 and 4:
City of Santa Monica, California Ye
- Page 5 and 6:
CITY OF SANTA MONICA, CALIFORNIA Co
- Page 7:
CITY OF SANTA MONICA, CALIFORNIA Co
- Page 10 and 11:
Master Plan; (2) an ongoing commitm
- Page 12 and 13:
needs of City infrastructure and fa
- Page 15 and 16:
OFFICIALS OF THE CITY OF SANTA MONI
- Page 17 and 18:
Certificate of Achievement for Exce
- Page 19 and 20:
The Honorable Mayor and City Counci
- Page 21 and 22:
CITY OF SANTA MONICA, CALIFORNIA Ma
- Page 23 and 24:
CITY OF SANTA MONICA, CALIFORNIA Ma
- Page 25 and 26:
CITY OF SANTA MONICA, CALIFORNIA Ma
- Page 27 and 28:
CITY OF SANTA MONICA, CALIFORNIA Ma
- Page 29 and 30:
CITY OF SANTA MONICA, CALIFORNIA Ma
- Page 31 and 32:
CITY OF SANTA MONICA, CALIFORNIA Ma
- Page 33 and 34:
City of Santa Monica, California Ye
- Page 35 and 36:
CITY OF SANTA MONICA, CALIFORNIA St
- Page 37 and 38:
CITY OF SANTA MONICA, CALIFORNIA Ba
- Page 39 and 40:
CITY OF SANTA MONICA, CALIFORNIA Re
- Page 41 and 42:
CITY OF SANTA MONICA, CALIFORNIA St
- Page 43 and 44:
CITY OF SANTA MONICA, CALIFORNIA St
- Page 45 and 46:
THIS PAGE INTENTIONALLY LEFT BLANK
- Page 47 and 48:
CITY OF SANTA MONICA, CALIFORNIA St
- Page 49 and 50:
CITY OF SANTA MONICA, CALIFORNIA St
- Page 51 and 52:
CITY OF SANTA MONICA, CALIFORNIA St
- Page 53 and 54:
CITY OF SANTA MONICA, CALIFORNIA St
- Page 55 and 56:
CITY OF SANTA MONICA, CALIFORNIA No
- Page 57 and 58:
CITY OF SANTA MONICA, CALIFORNIA No
- Page 59 and 60:
CITY OF SANTA MONICA, CALIFORNIA No
- Page 61 and 62:
CITY OF SANTA MONICA, CALIFORNIA No
- Page 63 and 64:
CITY OF SANTA MONICA, CALIFORNIA No
- Page 65 and 66:
CITY OF SANTA MONICA, CALIFORNIA No
- Page 67 and 68:
CITY OF SANTA MONICA, CALIFORNIA No
- Page 69 and 70:
CITY OF SANTA MONICA, CALIFORNIA No
- Page 71 and 72:
CITY OF SANTA MONICA, CALIFORNIA No
- Page 73 and 74:
CITY OF SANTA MONICA, CALIFORNIA No
- Page 75 and 76:
CITY OF SANTA MONICA, CALIFORNIA No
- Page 77 and 78:
CITY OF SANTA MONICA, CALIFORNIA No
- Page 79 and 80:
CITY OF SANTA MONICA, CALIFORNIA No
- Page 81 and 82:
CITY OF SANTA MONICA, CALIFORNIA No
- Page 83 and 84:
CITY OF SANTA MONICA, CALIFORNIA No
- Page 85 and 86:
CITY OF SANTA MONICA, CALIFORNIA No
- Page 87 and 88:
CITY OF SANTA MONICA, CALIFORNIA No
- Page 89 and 90:
CITY OF SANTA MONICA, CALIFORNIA No
- Page 91 and 92:
CITY OF SANTA MONICA, CALIFORNIA No
- Page 93 and 94:
CITY OF SANTA MONICA, CALIFORNIA No
- Page 95 and 96:
CITY OF SANTA MONICA, CALIFORNIA No
- Page 97 and 98:
CITY OF SANTA MONICA, CALIFORNIA No
- Page 99 and 100:
CITY OF SANTA MONICA, CALIFORNIA No
- Page 101 and 102:
THIS PAGE INTENTIONALLY LEFT BLANK
- Page 103 and 104:
CITY OF SANTA MONICA, CALIFORNIA Re
- Page 106 and 107:
CITY OF SANTA MONICA, CALIFORNIA No
- Page 108 and 109: THIS PAGE INTENTIONALLY LEFT BLANK
- Page 110 and 111: CITY OF SANTA MONICA, CALIFORNIA Co
- Page 112 and 113: Total nonmajor Citizens special Mis
- Page 114 and 115: Total nonmajor Citizens special Mis
- Page 116 and 117: CITY OF SANTA MONICA, CALIFORNIA Sc
- Page 118 and 119: CITY OF SANTA MONICA, CALIFORNIA St
- Page 120 and 121: CITY OF SANTA MONICA, CALIFORNIA Sc
- Page 122 and 123: CITY OF SANTA MONICA, CALIFORNIA Sc
- Page 124 and 125: CITY OF SANTA MONICA, CALIFORNIA Sc
- Page 126 and 127: CITY OF SANTA MONICA, CALIFORNIA Sc
- Page 128 and 129: CITY OF SANTA MONICA, CALIFORNIA Co
- Page 130 and 131: CITY OF SANTA MONICA, CALIFORNIA Sc
- Page 132 and 133: CITY OF SANTA MONICA, CALIFORNIA Sc
- Page 134 and 135: THIS PAGE INTENTIONALLY LEFT BLANK
- Page 136 and 137: CITY OF SANTA MONICA, CALIFORNIA Co
- Page 138 and 139: CITY OF SANTA MONICA, CALIFORNIA Co
- Page 140 and 141: CITY OF SANTA MONICA, CALIFORNIA No
- Page 142 and 143: CITY OF SANTA MONICA, CALIFORNIA St
- Page 144 and 145: CITY OF SANTA MONICA, CALIFORNIA St
- Page 146 and 147: CITY OF SANTA MONICA, CALIFORNIA In
- Page 148 and 149: CITY OF SANTA MONICA, CALIFORNIA St
- Page 150 and 151: CITY OF SANTA MONICA, CALIFORNIA Fi
- Page 152 and 153: CITY OF SANTA MONICA, CALIFORNIA Co
- Page 154 and 155: City of Santa Monica, California Ye
- Page 156 and 157: CITY OF SANTA MONICA, CALIFORNIA Fo
- Page 160 and 161: CITY OF SANTA MONICA, CALIFORNIA Fu
- Page 162 and 163: CITY OF SANTA MONICA, CALIFORNIA Ch
- Page 164 and 165: CITY OF SANTA MONICA, CALIFORNIA As
- Page 166 and 167: CITY OF SANTA MONICA, CALIFORNIA Pr
- Page 168 and 169: CITY OF SANTA MONICA, CALIFORNIA Ta
- Page 170 and 171: CITY OF SANTA MONICA, CALIFORNIA Ra
- Page 172 and 173: CITY OF SANTA MONICA, CALIFORNIA Co
- Page 174 and 175: CITY OF SANTA MONICA, CALIFORNIA Re
- Page 176 and 177: CITY OF SANTA MONICA, CALIFORNIA Re
- Page 178 and 179: CITY OF SANTA MONICA, CALIFORNIA Pr
- Page 180 and 181: CITY OF SANTA MONICA, CALIFORNIA Op
- Page 182: THIS PAGE INTENTIONALLY LEFT BLANK