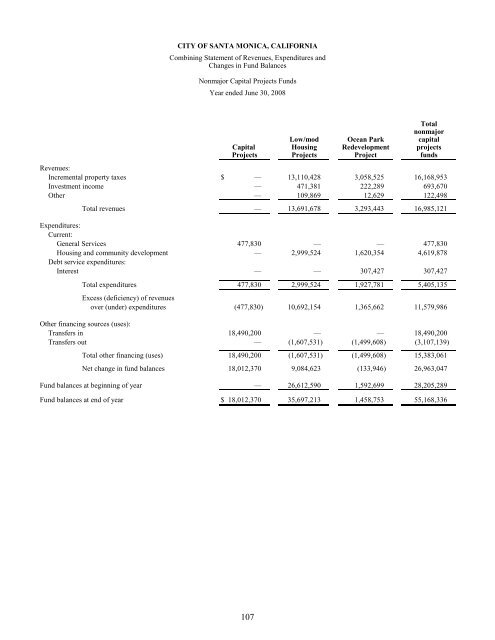
CITY OF SANTA MONICA, CALIFORNIA Combining Statement <strong>of</strong> Revenues, Expenditures and Changes in Fund Balances Nonmajor Capital Projects Funds Year ended June 30, 2008 Total nonmajor Low/mod Ocean Park capital Capital Housing Redevelopment projects Projects Projects Project funds Revenues: Incremental property taxes $ — 13,110,428 3,058,525 16,168,953 Investment income — 471,381 222,289 693,670 Other — 109,869 12,629 122,498 Total revenues — 13,691,678 3,293,443 16,985,121 Expenditures: Current: General Services 477,830 — — 477,830 Housing and community development — 2,999,524 1,620,354 4,619,878 Debt service expenditures: Interest — — 307,427 307,427 Total expenditures 477,830 2,999,524 1,927,781 5,405,135 Excess (deficiency) <strong>of</strong> revenues over (under) expenditures (477,830) 10,692,154 1,365,662 11,579,986 Other financing sources (uses): Transfers in 18,490,200 — — 18,490,200 Transfers out — (1,607,531) (1,499,608) (3,107,139) Total other financing (uses) 18,490,200 (1,607,531) (1,499,608) 15,383,061 Net change in fund balances 18,012,370 9,084,623 (133,946) 26,963,047 Fund balances at beginning <strong>of</strong> year — 26,612,590 1,592,699 28,205,289 Fund balances at end <strong>of</strong> year $ 18,012,370 35,697,213 1,458,753 55,168,336 107
CITY OF SANTA MONICA, CALIFORNIA Schedule <strong>of</strong> Revenues, Expenditures and Changes in Fund Balance (Deficit) – Budget and Actual (Non-GAAP Basis) Downtown Redevelopment Project Capital Projects Fund (Major Fund) Year ended June 30, 2008 108 Less 2006-2007 Plus Actual, Variance – Original Final encumbered 2007-2008 budgetary positive budget budget Actual expenditures* encumbrances basis (negative) Revenues: Incremental property taxes $ 1,034,663 1,034,663 1,168,638 — — 1,168,638 133,975 Investment income 58,000 58,000 63,584 — — 63,584 5,584 Rental income 1,340,320 1,340,320 1,220,200 — — 1,220,200 (120,120) Other income — — 1,450,143 — — 1,450,143 1,450,143 Total project revenues 2,432,983 2,432,983 3,902,565 — — 3,902,565 1,469,582 Expenditures: Housing and community development: Supplies 632,477 632,477 618,553 — — 618,553 13,924 Capital improvements 1,400,000 1,950,994 137,548 — 249,771 387,319 1,563,675 Total housing and community development 2,032,477 2,583,471 756,101 — 249,771 1,005,872 1,577,599 Debt service expenditures – interest 354,867 354,867 861,972 — — 861,972 (507,105) Total project expenditures 2,387,344 2,938,338 1,618,073 — 249,771 1,867,844 1,070,494 Excess (deficiency) <strong>of</strong> revenues over (under) expenditures 45,639 (505,355) 2,284,492 — (249,771) 2,034,721 2,540,076 Other financing (uses): Transfers out (1,465,353) (1,465,353) (1,465,353) — — (1,465,353) — Net change in fund balance (1,419,714) (1,970,708) 819,139 — (249,771) 569,368 2,540,076 Fund deficit at beginning <strong>of</strong> year (15,870,048) (15,870,048) (15,870,048) — — (15,870,048) — Fund deficit at end <strong>of</strong> year $ (17,289,762) (17,840,756) (15,050,909) — (249,771) (15,300,680) 2,540,076 * No encumbrances were outstanding at June 30, 2007.
- Page 1 and 2:
City of Santa Monica Comprehensive
- Page 3 and 4:
City of Santa Monica, California Ye
- Page 5 and 6:
CITY OF SANTA MONICA, CALIFORNIA Co
- Page 7:
CITY OF SANTA MONICA, CALIFORNIA Co
- Page 10 and 11:
Master Plan; (2) an ongoing commitm
- Page 12 and 13:
needs of City infrastructure and fa
- Page 15 and 16:
OFFICIALS OF THE CITY OF SANTA MONI
- Page 17 and 18:
Certificate of Achievement for Exce
- Page 19 and 20:
The Honorable Mayor and City Counci
- Page 21 and 22:
CITY OF SANTA MONICA, CALIFORNIA Ma
- Page 23 and 24:
CITY OF SANTA MONICA, CALIFORNIA Ma
- Page 25 and 26:
CITY OF SANTA MONICA, CALIFORNIA Ma
- Page 27 and 28:
CITY OF SANTA MONICA, CALIFORNIA Ma
- Page 29 and 30:
CITY OF SANTA MONICA, CALIFORNIA Ma
- Page 31 and 32:
CITY OF SANTA MONICA, CALIFORNIA Ma
- Page 33 and 34:
City of Santa Monica, California Ye
- Page 35 and 36:
CITY OF SANTA MONICA, CALIFORNIA St
- Page 37 and 38:
CITY OF SANTA MONICA, CALIFORNIA Ba
- Page 39 and 40:
CITY OF SANTA MONICA, CALIFORNIA Re
- Page 41 and 42:
CITY OF SANTA MONICA, CALIFORNIA St
- Page 43 and 44:
CITY OF SANTA MONICA, CALIFORNIA St
- Page 45 and 46:
THIS PAGE INTENTIONALLY LEFT BLANK
- Page 47 and 48:
CITY OF SANTA MONICA, CALIFORNIA St
- Page 49 and 50:
CITY OF SANTA MONICA, CALIFORNIA St
- Page 51 and 52:
CITY OF SANTA MONICA, CALIFORNIA St
- Page 53 and 54:
CITY OF SANTA MONICA, CALIFORNIA St
- Page 55 and 56:
CITY OF SANTA MONICA, CALIFORNIA No
- Page 57 and 58:
CITY OF SANTA MONICA, CALIFORNIA No
- Page 59 and 60:
CITY OF SANTA MONICA, CALIFORNIA No
- Page 61 and 62:
CITY OF SANTA MONICA, CALIFORNIA No
- Page 63 and 64:
CITY OF SANTA MONICA, CALIFORNIA No
- Page 65 and 66:
CITY OF SANTA MONICA, CALIFORNIA No
- Page 67 and 68:
CITY OF SANTA MONICA, CALIFORNIA No
- Page 69 and 70:
CITY OF SANTA MONICA, CALIFORNIA No
- Page 71 and 72:
CITY OF SANTA MONICA, CALIFORNIA No
- Page 73 and 74:
CITY OF SANTA MONICA, CALIFORNIA No
- Page 75 and 76:
CITY OF SANTA MONICA, CALIFORNIA No
- Page 77 and 78: CITY OF SANTA MONICA, CALIFORNIA No
- Page 79 and 80: CITY OF SANTA MONICA, CALIFORNIA No
- Page 81 and 82: CITY OF SANTA MONICA, CALIFORNIA No
- Page 83 and 84: CITY OF SANTA MONICA, CALIFORNIA No
- Page 85 and 86: CITY OF SANTA MONICA, CALIFORNIA No
- Page 87 and 88: CITY OF SANTA MONICA, CALIFORNIA No
- Page 89 and 90: CITY OF SANTA MONICA, CALIFORNIA No
- Page 91 and 92: CITY OF SANTA MONICA, CALIFORNIA No
- Page 93 and 94: CITY OF SANTA MONICA, CALIFORNIA No
- Page 95 and 96: CITY OF SANTA MONICA, CALIFORNIA No
- Page 97 and 98: CITY OF SANTA MONICA, CALIFORNIA No
- Page 99 and 100: CITY OF SANTA MONICA, CALIFORNIA No
- Page 101 and 102: THIS PAGE INTENTIONALLY LEFT BLANK
- Page 103 and 104: CITY OF SANTA MONICA, CALIFORNIA Re
- Page 106 and 107: CITY OF SANTA MONICA, CALIFORNIA No
- Page 108 and 109: THIS PAGE INTENTIONALLY LEFT BLANK
- Page 110 and 111: CITY OF SANTA MONICA, CALIFORNIA Co
- Page 112 and 113: Total nonmajor Citizens special Mis
- Page 114 and 115: Total nonmajor Citizens special Mis
- Page 116 and 117: CITY OF SANTA MONICA, CALIFORNIA Sc
- Page 118 and 119: CITY OF SANTA MONICA, CALIFORNIA St
- Page 120 and 121: CITY OF SANTA MONICA, CALIFORNIA Sc
- Page 122 and 123: CITY OF SANTA MONICA, CALIFORNIA Sc
- Page 124 and 125: CITY OF SANTA MONICA, CALIFORNIA Sc
- Page 126 and 127: CITY OF SANTA MONICA, CALIFORNIA Sc
- Page 130 and 131: CITY OF SANTA MONICA, CALIFORNIA Sc
- Page 132 and 133: CITY OF SANTA MONICA, CALIFORNIA Sc
- Page 134 and 135: THIS PAGE INTENTIONALLY LEFT BLANK
- Page 136 and 137: CITY OF SANTA MONICA, CALIFORNIA Co
- Page 138 and 139: CITY OF SANTA MONICA, CALIFORNIA Co
- Page 140 and 141: CITY OF SANTA MONICA, CALIFORNIA No
- Page 142 and 143: CITY OF SANTA MONICA, CALIFORNIA St
- Page 144 and 145: CITY OF SANTA MONICA, CALIFORNIA St
- Page 146 and 147: CITY OF SANTA MONICA, CALIFORNIA In
- Page 148 and 149: CITY OF SANTA MONICA, CALIFORNIA St
- Page 150 and 151: CITY OF SANTA MONICA, CALIFORNIA Fi
- Page 152 and 153: CITY OF SANTA MONICA, CALIFORNIA Co
- Page 154 and 155: City of Santa Monica, California Ye
- Page 156 and 157: CITY OF SANTA MONICA, CALIFORNIA Fo
- Page 158 and 159: CITY OF SANTA MONICA, CALIFORNIA Ch
- Page 160 and 161: CITY OF SANTA MONICA, CALIFORNIA Fu
- Page 162 and 163: CITY OF SANTA MONICA, CALIFORNIA Ch
- Page 164 and 165: CITY OF SANTA MONICA, CALIFORNIA As
- Page 166 and 167: CITY OF SANTA MONICA, CALIFORNIA Pr
- Page 168 and 169: CITY OF SANTA MONICA, CALIFORNIA Ta
- Page 170 and 171: CITY OF SANTA MONICA, CALIFORNIA Ra
- Page 172 and 173: CITY OF SANTA MONICA, CALIFORNIA Co
- Page 174 and 175: CITY OF SANTA MONICA, CALIFORNIA Re
- Page 176 and 177: CITY OF SANTA MONICA, CALIFORNIA Re
- Page 178 and 179:
CITY OF SANTA MONICA, CALIFORNIA Pr
- Page 180 and 181:
CITY OF SANTA MONICA, CALIFORNIA Op
- Page 182:
THIS PAGE INTENTIONALLY LEFT BLANK