

Comprehensive Annual Financial Report - City of Santa Monica
Comprehensive Annual Financial Report - City of Santa Monica
Comprehensive Annual Financial Report - City of Santa Monica

You also want an ePaper? Increase the reach of your titles
YUMPU automatically turns print PDFs into web optimized ePapers that Google loves.
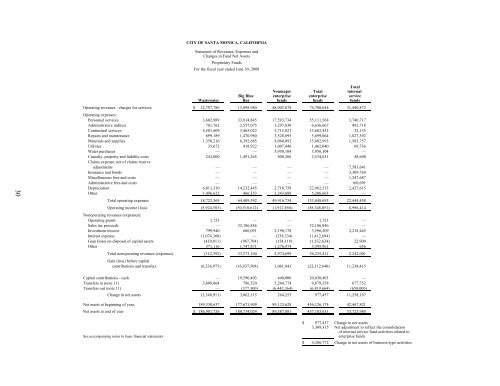
CITY OF SANTA MONICA, CALIFORNIA<br />
Statement <strong>of</strong> Revenues, Expenses and<br />
Changes in Fund Net Assets<br />
Proprietary Funds<br />
For the fiscal year ended June 30, 2008<br />
30<br />
Total<br />
Nonmajor Total internal<br />
Big Blue enterprise enterprise service<br />
Wastewater Bus funds funds funds<br />
Operating revenues - charges for services $ 12,797,786 13,898,980 48,003,878 74,700,644 31,440,872<br />
Operating expenses:<br />
Personnel services 3,602,989 33,914,845 17,593,734 55,111,568 3,740,717<br />
Administrative indirect 781,762 2,557,075 3,297,830 6,636,667 492,718<br />
Contractual services 4,501,609 3,465,022 5,715,821 13,682,452 32,135<br />
Repairs and maintenance 699,189 1,470,980 3,528,895 5,699,064 1,827,392<br />
Materials and supplies 1,350,216 6,392,685 8,060,092 15,802,993 1,503,757<br />
Utilities 35,672 418,922 1,007,446 1,462,040 69,736<br />
Water purchases — — 3,950,104 3,950,104 —<br />
Casualty, property and liability costs 243,000 1,491,265 800,366 2,534,631 48,600<br />
Claims expense, net <strong>of</strong> claims reserve<br />
adjustments — — — — 7,583,641<br />
Insurance and bonds — — — — 3,309,769<br />
Miscellaneous fees and costs — — — — 1,247,687<br />
Administrative fees and costs — — — — 160,691<br />
Depreciation 6,011,310 14,232,445 2,718,758 22,962,513 2,427,615<br />
Other 1,496,622 466,353 3,243,688 5,206,663 —<br />
Total operating expenses 18,722,369 64,409,592 49,916,734 133,048,695 22,444,458<br />
Operating income (loss) (5,924,583) (50,510,612) (1,912,856) (58,348,051) 8,996,414<br />
Nonoperating revenues (expenses):<br />
Operating grants 1,723 — — 1,723 —<br />
Sales tax proceeds — 32,186,846 — 32,186,846 —<br />
Investment income 799,940 606,091 2,190,178 3,596,209 2,218,445<br />
Interest expense (1,074,360) — (338,334) (1,412,694) —<br />
Gain (loss) on disposal <strong>of</strong> capital assets (410,811) (967,704) (154,119) (1,532,634) 22,900<br />
Other 371,116 1,747,871 1,276,974 3,395,961 656<br />
Total nonoperating revenues (expenses) (312,392) 33,573,104 2,974,699 36,235,411 2,242,001<br />
Gain (loss) before capital<br />
contributions and transfers (6,236,975) (16,937,508) 1,061,843 (22,112,640) 11,238,415<br />
Capital contributions - cash — 19,590,403 440,000 20,030,403 —<br />
Transfers in (note 11) 3,888,064 786,520 5,204,774 9,879,358 677,752<br />
Transfers out (note 11) — (377,300) (6,442,364) (6,819,664) (658,000)<br />
Change in net assets (2,348,911) 3,062,115 264,253 977,457 11,258,167<br />
Net assets at beginning <strong>of</strong> year, 189,330,637 177,671,909 89,123,628 456,126,174 42,467,821<br />
Net assets at end <strong>of</strong> year $ 186,981,726 180,734,024 89,387,881 457,103,631 53,725,988<br />
$ 977,457 Change in net assets<br />
3,309,315 Net adjustment to reflect the consolidation<br />
<strong>of</strong> internal service fund activities related to<br />
See accompanying notes to basic financial statements. enterprise funds<br />
$ 4,286,772 Change in net assets <strong>of</strong> business-type activities


