Comprehensive Annual Financial Report - City of Santa Monica
Comprehensive Annual Financial Report - City of Santa Monica
Comprehensive Annual Financial Report - City of Santa Monica
You also want an ePaper? Increase the reach of your titles
YUMPU automatically turns print PDFs into web optimized ePapers that Google loves.
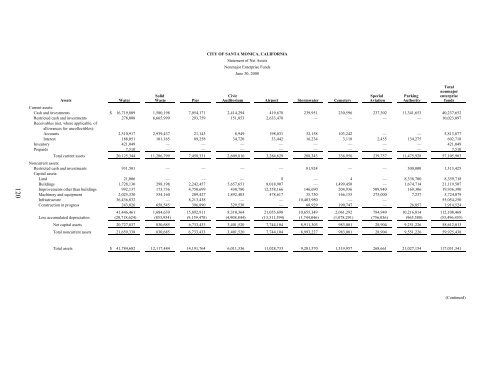
CITY OF SANTA MONICA, CALIFORNIA<br />
Statement <strong>of</strong> Net Assets<br />
Nonmajor Enterprise Funds<br />
June 30, 2008<br />
120<br />
Total<br />
nonmajor<br />
Solid Civic Special Parking enterprise<br />
Assets Water Waste Pier Auditorium Airport Stormwater Cemetery Aviation Authority funds<br />
Current assets:<br />
Cash and investments $ 16,719,809 1,580,198 7,054,171 2,414,294 419,678 239,951 230,596 237,302 11,341,653 40,237,652<br />
Restricted cash and investments 278,008 6,665,999 293,759 151,853 2,633,478 — — — — 10,023,097<br />
Receivables (net, where applicable, <strong>of</strong><br />
allowances for uncollectibles):<br />
Accounts 2,510,917 2,939,437 21,143 8,949 198,031 32,158 103,242 — — 5,813,877<br />
Interest 188,051 101,165 89,258 34,720 33,442 16,234 3,118 2,455 134,275 602,718<br />
Inventory 421,049 — — — — — — — — 421,049<br />
Prepaids 7,510 — — — — — — — — 7,510<br />
Total current assets 20,125,344 11,286,799 7,458,331 2,609,816 3,284,629 288,343 336,956 239,757 11,475,928 57,105,903<br />
Noncurrent assets:<br />
Restricted cash and investments 931,501 — — — — 81,924 — — 300,000 1,313,425<br />
Capital assets:<br />
Land 21,006 — — — 8 — 4 — 8,338,700 , 8,359,718<br />
,<br />
Buildings 1,728,130 298,198 2,242,457 5,657,651 8,018,907 — 1,499,450 — 1,674,714 21,119,507<br />
Improvements other than buildings 992,137 173,736 4,750,699 430,780 12,558,166 146,690 204,936 509,940 169,306 19,936,390<br />
Machinery and equipment 2,025,330 554,160 289,427 1,892,403 478,617 35,750 166,155 275,000 7,237 5,724,079<br />
Infrastructure 36,436,832 — 8,213,438 — — 10,403,980 — — 55,054,250<br />
Construction in progress 243,026 658,545 396,890 329,530 — 68,929 190,747 — 26,857 1,914,524<br />
41,446,461 1,684,639 15,892,911 8,310,364 21,055,698 10,655,349 2,061,292 784,940 10,216,814 112,108,468<br />
Less accumulated depreciation (20,718,624) (853,954) (9,159,478) (4,908,844) (13,311,594) (1,744,046) (1,078,291) (756,036) (965,588) (53,496,455)<br />
Net capital assets 20,727,837 830,685 6,733,433 3,401,520 7,744,104 8,911,303 983,001 28,904 9,251,226 58,612,013<br />
Total noncurrent assets 21,659,338 830,685 6,733,433 3,401,520 7,744,104 8,993,227 983,001 28,904 9,551,226 59,925,438<br />
Total assets $ 41,784,682 12,117,484 14,191,764 6,011,336 11,028,733 9,281,570 1,319,957 268,661 21,027,154 117,031,341<br />
(Continued)


