

Comprehensive Annual Financial Report - City of Santa Monica
Comprehensive Annual Financial Report - City of Santa Monica
Comprehensive Annual Financial Report - City of Santa Monica

Create successful ePaper yourself
Turn your PDF publications into a flip-book with our unique Google optimized e-Paper software.
CITY OF SANTA MONICA, CALIFORNIA<br />
Notes to Basic <strong>Financial</strong> Statements, Continued<br />
For the fiscal year ended June 30, 2008<br />
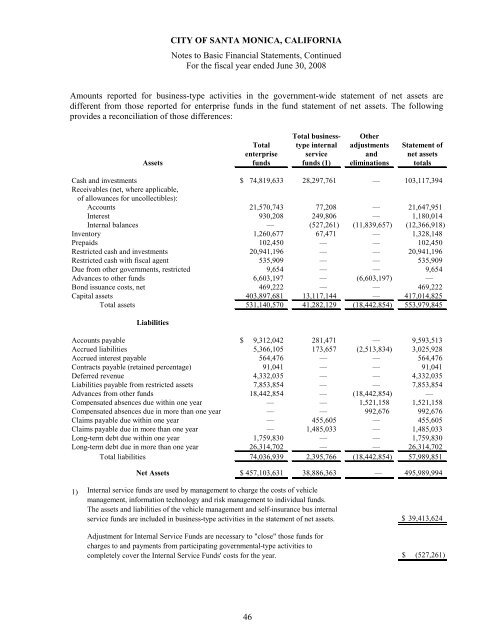
Amounts reported for business-type activities in the government-wide statement <strong>of</strong> net assets are<br />
different from those reported for enterprise funds in the fund statement <strong>of</strong> net assets. The following<br />
provides a reconciliation <strong>of</strong> those differences:<br />
Assets<br />
Total business- Other<br />
Total type internal adjustments Statement <strong>of</strong><br />
enterprise service and net assets<br />
funds funds (1) eliminations totals<br />
Cash and investments $ 74,819,633 28,297,761 — 103,117,394<br />
Receivables (net, where applicable,<br />
<strong>of</strong> allowances for uncollectibles):<br />
Accounts 21,570,743 77,208 — 21,647,951<br />
Interest 930,208 249,806 — 1,180,014<br />
Internal balances — (527,261) (11,839,657) (12,366,918)<br />
Inventory 1,260,677 67,471 — 1,328,148<br />
Prepaids 102,450 — — 102,450<br />
Restricted cash and investments 20,941,196 — — 20,941,196<br />
Restricted cash with fiscal agent 535,909 — — 535,909<br />
Due from other governments, restricted 9,654 — — 9,654<br />
Advances to other funds 6,603,197 — (6,603,197) —<br />
Bond issuance costs, net 469,222 — — 469,222<br />
Capital assets 403,897,681 13,117,144 — 417,014,825<br />
Total assets 531,140,570 41,282,129 (18,442,854) 553,979,845<br />
Liabilities<br />
Accounts payable $ 9,312,042 281,471 — 9,593,513<br />
Accrued liabilities 5,366,105 173,657 (2,513,834) 3,025,928<br />
Accrued interest payable 564,476 — — 564,476<br />
Contracts payable (retained percentage) 91,041 — — 91,041<br />
Deferred revenue 4,332,035 — — 4,332,035<br />
Liabilities payable from restricted assets 7,853,854 — — 7,853,854<br />
Advances from other funds 18,442,854 — (18,442,854) —<br />
Compensated absences due within one year — — 1,521,158 1,521,158<br />
Compensated absences due in more than one year — — 992,676 992,676<br />
Claims payable due within one year — 455,605 — 455,605<br />
Claims payable due in more than one year — 1,485,033 — 1,485,033<br />
Long-term debt due within one year 1,759,830 — — 1,759,830<br />
Long-term debt due in more than one year 26,314,702 — — 26,314,702<br />
Total liabilities 74,036,939 2,395,766 (18,442,854) 57,989,851<br />
Net Assets<br />
$ 457,103,631 38,886,363 — 495,989,994<br />
1)<br />
Internal service funds are used by management to charge the costs <strong>of</strong> vehicle<br />
management, information technology and risk management to individual funds.<br />
The assets and liabilities <strong>of</strong> the vehicle management and self-insurance bus internal<br />
service funds are included in business-type activities in the statement <strong>of</strong> net assets.<br />
$ 39,413,624<br />
Adjustment for Internal Service Funds are necessary to "close" those funds for<br />
charges to and payments from participating governmental-type activities to<br />
completely cover the Internal Service Funds' costs for the year.<br />
$<br />
(527,261)<br />
46


