CITY OF SANTA MONICA, CALIFORNIA Statement <strong>of</strong> Revenues, Expenses and Changes in Fund Net Assets All Internal Service Funds Year ended June 30, 2008 127 Information Total Technology Self-Insurance Self-Insurance internal Vehicle Replacement Compre- Self-Insurance Self-Insurance Workers’ service Management and Services hensive Bus Auto Compensation funds Operating revenues – charges for services $ 10,873,750 1,827,994 10,133,569 1,592,500 758,766 6,254,293 31,440,872 Operating expenses: Personnel services 2,349,849 — — — — 1,390,868 3,740,717 Administrative indirect 492,718 — — — — — 492,718 Contractual services 32,135 — — — — — 32,135 Repairs and maintenance 1,827,392 — — — — — 1,827,392 Materials and supplies 398,994 1,084,015 — — — 20,748 1,503,757 Utilities 67,908 — — — — 1,828 69,736 Casualty and liabilities 48,600 — — — — — 48,600 Claims expense, net <strong>of</strong> claims reserve adjustments — — 1,066,404 833,433 433,613 5,250,191 7,583,641 Insurance and bonds — — 2,707,502 258,201 4,615 339,451 3,309,769 Miscellaneous fees and costs 454,679 — 438,471 75,552 56,270 222,715 1,247,687 Administrative fees — — 2,025 — — 158,666 160,691 Depreciation 2,173,366 254,249 — — — — 2,427,615 Total operating expenses 7,845,641 1,338,264 4,214,402 1,167,186 494,498 7,384,467 22,444,458 Operating income (loss) 3,028,109 489,730 5,919,167 425,314 264,268 (1,130,174) 8,996,414 Nonoperating revenues: Investment income 826,120 169,804 92,780 67,282 64,004 998,455 2,218,445 Gain or (loss) on disposal <strong>of</strong> capital assets 25,876 (1) — — — (2,975) 22,900 Other revenue — — — — — 656 656 Total nonoperating revenues 851,996 169,803 92,780 67,282 64,004 996,136 2,242,001 Income (loss) before operating transfers 3,880,105 659,533 6,011,947 492,596 328,272 (134,038) 11,238,415 Transfers in 12,346 — — — — 665,406 677,752 Transfers out — — (305,000) (257,000) (96,000) — (658,000) Change in net assets 3,892,451 659,533 5,706,947 235,596 232,272 531,368 11,258,167 Net assets at beginning <strong>of</strong> year, 35,279,203 4,475,328 (2,489,436) 6,373 1,214,029 3,982,324 42,467,821 Total net assets at end <strong>of</strong> year $ 39,171,654 5,134,861 3,217,511 241,969 1,446,301 4,513,692 53,725,988
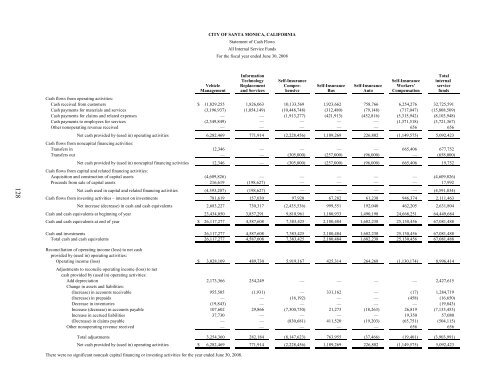
CITY OF SANTA MONICA, CALIFORNIA Statement <strong>of</strong> Cash Flows All Internal Service Funds For the fiscal year ended June 30, 2008 128 Information Total Technology Self-Insurance Self-Insurance internal Vehicle Replacement Compre- Self-Insurance Self-Insurance Workers’ service Management and Services hensive Bus Auto Compensation funds Cash flows from operating activities: Cash received from customers $ 11,829,255 1,826,063 10,133,569 1,923,662 758,766 6,254,276 32,725,591 Cash payments for materials and services (3,196,937) (1,054,149) (10,448,748) (312,480) (79,148) (717,047) (15,808,509) Cash payments for claims and related expenses — — (1,913,277) (421,913) (452,816) (5,315,942) (8,103,948) Cash payments to employees for services (2,349,849) — — — — (1,371,518) (3,721,367) Other nonoperating revenue received — — — — — 656 656 Net cash provided by (used in) operating activities 6,282,469 771,914 (2,228,456) 1,189,269 226,802 (1,149,575) 5,092,423 Cash flows from noncapital financing activities: Transfers in 12,346 — — — — 665,406 677,752 Transfers out — — (305,000) (257,000) (96,000) — (658,000) Net cash provided by (used in) noncapital financing activities 12,346 — (305,000) (257,000) (96,000) 665,406 19,752 Cash flows from capital and related financing activities: Acquisition and construction <strong>of</strong> capital assets (4,609,826) — — — — — (4,609,826) Proceeds from sale <strong>of</strong> capital assets 216,619 (198,627) — — — — 17,992 Net cash used in capital and related financing activities (4,393,207) (198,627) — — — — (4,591,834) Cash flows from investing activities – interest on investments 781,619 157,030 97,920 67,282 61,238 946,374 2,111,463 Net increase (decrease) in cash and cash equivalents 2,683,227 730,317 (2,435,536) 999,551 192,040 462,205 2,631,804 Cash and cash equivalents at beginning <strong>of</strong> year 23,434,050 3,857,291 9,818,961 1,180,933 1,490,198 24,668,251 64,449,684 Cash and cash equivalents at end <strong>of</strong> year $ 26,117,277 4,587,608 7,383,425 2,180,484 1,682,238 25,130,456 67,081,488 Cash and investments 26,117,277 4,587,608 7,383,425 2,180,484 1,682,238 25,130,456 67,081,488 Total cash and cash equivalents 26,117,277 4,587,608 7,383,425 2,180,484 1,682,238 25,130,456 67,081,488 Reconciliation <strong>of</strong> operating income (loss) to net cash provided by (used in) operating activities: Operating income (loss) $ 3,028,109 489,730 5,919,167 425,314 264,268 (1,130,174) 8,996,414 Adjustments to reconcile operating income (loss) to net cash provided by (used in) operating activities: Add depreciation 2,173,366 254,249 — — — — 2,427,615 Change in assets and liabilities: (Increase) in accounts receivable 955,505 (1,931) — 331,162 — (17) 1,284,719 (Increase) in prepaids — — (16,192) — — (458) (16,650) Decrease in inventories (19,843) — — — — — (19,843) Increase (decrease) in accounts payable 107,602 29,866 (7,300,750) 21,273 (18,263) 26,819 (7,133,453) Increase in accrued liabilities 37,730 — — — — 19,350 57,080 (Decrease) in claims payable — — (830,681) 411,520 (19,203) (65,751) (504,115) Other nonoperating revenue received — — — — — 656 656 Total adjustments 3,254,360 282,184 (8,147,623) 763,955 (37,466) (19,401) (3,903,991) Net cash provided by (used in) operating activities $ 6,282,469 771,914 (2,228,456) 1,189,269 226,802 (1,149,575) 5,092,423 There were no significant noncash capital financing or investing activities for the year ended June 30, 2008.
- Page 1 and 2:
City of Santa Monica Comprehensive
- Page 3 and 4:
City of Santa Monica, California Ye
- Page 5 and 6:
CITY OF SANTA MONICA, CALIFORNIA Co
- Page 7:
CITY OF SANTA MONICA, CALIFORNIA Co
- Page 10 and 11:
Master Plan; (2) an ongoing commitm
- Page 12 and 13:
needs of City infrastructure and fa
- Page 15 and 16:
OFFICIALS OF THE CITY OF SANTA MONI
- Page 17 and 18:
Certificate of Achievement for Exce
- Page 19 and 20:
The Honorable Mayor and City Counci
- Page 21 and 22:
CITY OF SANTA MONICA, CALIFORNIA Ma
- Page 23 and 24:
CITY OF SANTA MONICA, CALIFORNIA Ma
- Page 25 and 26:
CITY OF SANTA MONICA, CALIFORNIA Ma
- Page 27 and 28:
CITY OF SANTA MONICA, CALIFORNIA Ma
- Page 29 and 30:
CITY OF SANTA MONICA, CALIFORNIA Ma
- Page 31 and 32:
CITY OF SANTA MONICA, CALIFORNIA Ma
- Page 33 and 34:
City of Santa Monica, California Ye
- Page 35 and 36:
CITY OF SANTA MONICA, CALIFORNIA St
- Page 37 and 38:
CITY OF SANTA MONICA, CALIFORNIA Ba
- Page 39 and 40:
CITY OF SANTA MONICA, CALIFORNIA Re
- Page 41 and 42:
CITY OF SANTA MONICA, CALIFORNIA St
- Page 43 and 44:
CITY OF SANTA MONICA, CALIFORNIA St
- Page 45 and 46:
THIS PAGE INTENTIONALLY LEFT BLANK
- Page 47 and 48:
CITY OF SANTA MONICA, CALIFORNIA St
- Page 49 and 50:
CITY OF SANTA MONICA, CALIFORNIA St
- Page 51 and 52:
CITY OF SANTA MONICA, CALIFORNIA St
- Page 53 and 54:
CITY OF SANTA MONICA, CALIFORNIA St
- Page 55 and 56:
CITY OF SANTA MONICA, CALIFORNIA No
- Page 57 and 58:
CITY OF SANTA MONICA, CALIFORNIA No
- Page 59 and 60:
CITY OF SANTA MONICA, CALIFORNIA No
- Page 61 and 62:
CITY OF SANTA MONICA, CALIFORNIA No
- Page 63 and 64:
CITY OF SANTA MONICA, CALIFORNIA No
- Page 65 and 66:
CITY OF SANTA MONICA, CALIFORNIA No
- Page 67 and 68:
CITY OF SANTA MONICA, CALIFORNIA No
- Page 69 and 70:
CITY OF SANTA MONICA, CALIFORNIA No
- Page 71 and 72:
CITY OF SANTA MONICA, CALIFORNIA No
- Page 73 and 74:
CITY OF SANTA MONICA, CALIFORNIA No
- Page 75 and 76:
CITY OF SANTA MONICA, CALIFORNIA No
- Page 77 and 78:
CITY OF SANTA MONICA, CALIFORNIA No
- Page 79 and 80:
CITY OF SANTA MONICA, CALIFORNIA No
- Page 81 and 82:
CITY OF SANTA MONICA, CALIFORNIA No
- Page 83 and 84:
CITY OF SANTA MONICA, CALIFORNIA No
- Page 85 and 86:
CITY OF SANTA MONICA, CALIFORNIA No
- Page 87 and 88:
CITY OF SANTA MONICA, CALIFORNIA No
- Page 89 and 90:
CITY OF SANTA MONICA, CALIFORNIA No
- Page 91 and 92:
CITY OF SANTA MONICA, CALIFORNIA No
- Page 93 and 94:
CITY OF SANTA MONICA, CALIFORNIA No
- Page 95 and 96:
CITY OF SANTA MONICA, CALIFORNIA No
- Page 97 and 98: CITY OF SANTA MONICA, CALIFORNIA No
- Page 99 and 100: CITY OF SANTA MONICA, CALIFORNIA No
- Page 101 and 102: THIS PAGE INTENTIONALLY LEFT BLANK
- Page 103 and 104: CITY OF SANTA MONICA, CALIFORNIA Re
- Page 106 and 107: CITY OF SANTA MONICA, CALIFORNIA No
- Page 108 and 109: THIS PAGE INTENTIONALLY LEFT BLANK
- Page 110 and 111: CITY OF SANTA MONICA, CALIFORNIA Co
- Page 112 and 113: Total nonmajor Citizens special Mis
- Page 114 and 115: Total nonmajor Citizens special Mis
- Page 116 and 117: CITY OF SANTA MONICA, CALIFORNIA Sc
- Page 118 and 119: CITY OF SANTA MONICA, CALIFORNIA St
- Page 120 and 121: CITY OF SANTA MONICA, CALIFORNIA Sc
- Page 122 and 123: CITY OF SANTA MONICA, CALIFORNIA Sc
- Page 124 and 125: CITY OF SANTA MONICA, CALIFORNIA Sc
- Page 126 and 127: CITY OF SANTA MONICA, CALIFORNIA Sc
- Page 128 and 129: CITY OF SANTA MONICA, CALIFORNIA Co
- Page 130 and 131: CITY OF SANTA MONICA, CALIFORNIA Sc
- Page 132 and 133: CITY OF SANTA MONICA, CALIFORNIA Sc
- Page 134 and 135: THIS PAGE INTENTIONALLY LEFT BLANK
- Page 136 and 137: CITY OF SANTA MONICA, CALIFORNIA Co
- Page 138 and 139: CITY OF SANTA MONICA, CALIFORNIA Co
- Page 140 and 141: CITY OF SANTA MONICA, CALIFORNIA No
- Page 142 and 143: CITY OF SANTA MONICA, CALIFORNIA St
- Page 144 and 145: CITY OF SANTA MONICA, CALIFORNIA St
- Page 146 and 147: CITY OF SANTA MONICA, CALIFORNIA In
- Page 150 and 151: CITY OF SANTA MONICA, CALIFORNIA Fi
- Page 152 and 153: CITY OF SANTA MONICA, CALIFORNIA Co
- Page 154 and 155: City of Santa Monica, California Ye
- Page 156 and 157: CITY OF SANTA MONICA, CALIFORNIA Fo
- Page 158 and 159: CITY OF SANTA MONICA, CALIFORNIA Ch
- Page 160 and 161: CITY OF SANTA MONICA, CALIFORNIA Fu
- Page 162 and 163: CITY OF SANTA MONICA, CALIFORNIA Ch
- Page 164 and 165: CITY OF SANTA MONICA, CALIFORNIA As
- Page 166 and 167: CITY OF SANTA MONICA, CALIFORNIA Pr
- Page 168 and 169: CITY OF SANTA MONICA, CALIFORNIA Ta
- Page 170 and 171: CITY OF SANTA MONICA, CALIFORNIA Ra
- Page 172 and 173: CITY OF SANTA MONICA, CALIFORNIA Co
- Page 174 and 175: CITY OF SANTA MONICA, CALIFORNIA Re
- Page 176 and 177: CITY OF SANTA MONICA, CALIFORNIA Re
- Page 178 and 179: CITY OF SANTA MONICA, CALIFORNIA Pr
- Page 180 and 181: CITY OF SANTA MONICA, CALIFORNIA Op
- Page 182: THIS PAGE INTENTIONALLY LEFT BLANK