

Comprehensive Annual Financial Report - City of Santa Monica
Comprehensive Annual Financial Report - City of Santa Monica
Comprehensive Annual Financial Report - City of Santa Monica

You also want an ePaper? Increase the reach of your titles
YUMPU automatically turns print PDFs into web optimized ePapers that Google loves.
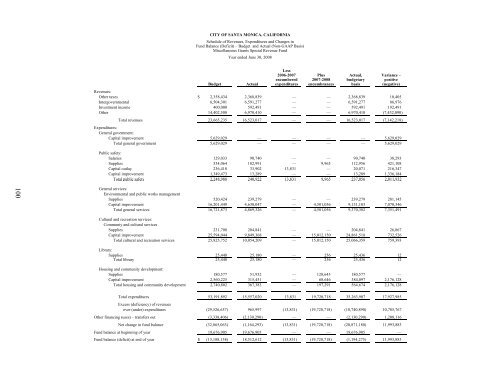
CITY OF SANTA MONICA, CALIFORNIA<br />
Schedule <strong>of</strong> Revenues, Expenditures and Changes in<br />
Fund Balance (Deficit) – Budget and Actual (Non-GAAP Basis)<br />
Miscellaneous Grants Special Revenue Fund<br />
Year ended June 30, 2008<br />
Less<br />
2006-2007 Plus Actual, Variance –<br />
encumbered 2007-2008 budgetary positive<br />
Budget Actual expenditures encumbrances basis (negative)<br />
Revenues:<br />
Other taxes $ 2,358,434 2,368,839 — — 2,368,839 10,405<br />
Intergovernmental 6,504,301 6,591,277 — — 6,591,277 86,976<br />
Investment income 400,000 592,491 — — 592,491 192,491<br />
Other 14,402,500 6,970,410 — — 6,970,410 (7,432,090)<br />
Total revenues 23,665,235 16,523,017 — — 16,523,017 (7,142,218)<br />
Expenditures:<br />
General government:<br />
Capital improvement 5,629,029 — — — — 5,629,029<br />
Total general government 5,629,029 — — — — 5,629,029<br />
Public safety:<br />
Salaries 129,033 90,740 — — 90,740 38,293<br />
Supplies 534,064 102,991 — 9,965 112,956 421,108<br />
Capital outlay 236,418 33,902 13,831 — 20,071 216,347<br />
Capital improvement 1,349,473 13,289 — — 13,289 1,336,184<br />
Total public safety 2,248,988 240,922 13,831 9,965 237,056 2,011,932<br />
100<br />
General services:<br />
Environmental and public works management<br />
Supplies 520,424 239,279 — — 239,279 281,145<br />
Capital improvement 16,201,449 4,630,047 — 4,501,056 9,131,103 7,070,346<br />
Total general services 16,721,873 4,869,326 — 4,501,056 9,370,382 7,351,491<br />
Cultural and recreation services:<br />
Communiy and cultural services<br />
Supplies 231,708 204,841 — — 204,841 26,867<br />
Capital improvement 25,594,044 9,849,368 — 15,012,150 24,861,518 732,526<br />
Total cultural and recreation services 25,825,752 10,054,209 — 15,012,150 25,066,359 759,393<br />
Library:<br />
Supplies 25,448 25,180 — 256 25,436 12<br />
Total library 25,448 25,180 — 256 25,436 12<br />
Housing and community development:<br />
Supplies 180,577 51,932 — 128,645 180,577 —<br />
Capital improvement 2,560,225 315,451 — 68,646 384,097 2,176,128<br />
Total housing and community development 2,740,802 367,383 — 197,291 564,674 2,176,128<br />
Total expenditures 53,191,892 15,557,020 13,831 19,720,718 35,263,907 17,927,985<br />
Excess (deficiency) <strong>of</strong> revenues<br />
over (under) expenditures (29,526,657) 965,997 (13,831) (19,720,718) (18,740,890) 10,785,767<br />
Other financing (uses) – transfers out (3,338,406) (2,130,290) — — (2,130,290) 1,208,116<br />
Net change in fund balance (32,865,063) (1,164,293) (13,831) (19,720,718) (20,871,180) 11,993,883<br />
Fund balance at beginning <strong>of</strong> year 19,676,905 19,676,905 — — 19,676,905 —<br />
Fund balance (deficit) at end <strong>of</strong> year $ (13,188,158) 18,512,612 (13,831) (19,720,718) (1,194,275) 11,993,883


