CITY OF SANTA MONICA, CALIFORNIA Statement <strong>of</strong> Net Assets June 30, 2008 Governmental Business-type activities activities Total Assets Cash and investments (note 5) $ 482,942,759 103,117,394 586,060,153 Receivables (net, where applicable, <strong>of</strong> allowances for uncollectibles): Accounts 7,574,792 21,647,951 29,222,743 Interest 3,673,202 1,180,014 4,853,216 Property taxes 5,272,603 — 5,272,603 Notes (note 6) 62,702,984 — 62,702,984 Other governments 14,513,046 — 14,513,046 Internal balances 12,366,918 (12,366,918) — Inventory 938,999 1,328,148 2,267,147 Prepaids 892,195 102,450 994,645 Restricted cash and investments (note 5) — 20,941,196 20,941,196 Restricted cash with fiscal agent (note 5) 30,055,545 535,909 30,591,454 Due from other governments, restricted — 9,654 9,654 Bond issuance costs, net 2,740,432 469,222 3,209,654 Capital assets not being depreciated (note 7): Land 145,240,508 72,634,413 217,874,921 Land held under easement 72,237,823 — 72,237,823 Construction in progress 43,306,737 42,884,961 86,191,698 Capital assets being depreciated (note 7): Buildings 253,854,273 67,940,845 321,795,118 Improvements other than buildings 77,194,062 23,221,260 100,415,322 Utility systems 5,198,568 — 5,198,568 Machinery and equipment 33,041,280 126,431,755 159,473,035 Infrastructure 324,776,828 264,599,015 589,375,843 Less accumulated depreciation (229,905,467) (180,697,424) (410,602,891) Total capital assets, net 724,944,612 417,014,825 1,141,959,437 Total assets 1,348,618,087 553,979,845 1,902,597,932 Liabilities Accounts payable 11,932,568 9,593,513 21,526,081 Accrued liabilities 8,082,310 3,025,928 11,108,238 Accrued interest payable 3,823,218 564,476 4,387,694 Short-term loans payable (note 17) 400,000 — 400,000 Contracts payable (retained percentage) 1,864,610 91,041 1,955,651 Unearned revenue (note 8) 103,579,844 4,332,035 107,911,879 Due to other governments 3,859,917 — 3,859,917 Liabilities payable from restricted assets 800,682 7,853,854 8,654,536 Long-term liabilities: Compensated absences due within one year (note 9) 5,174,471 1,521,158 6,695,629 Compensated absences due in more than one year (note 9) 4,420,073 992,676 5,412,749 Claims payable due within one year (note 9 and 15) 5,837,864 455,605 6,293,469 Claims payable due in more than one year (note 9 and 15) 19,278,549 1,485,033 20,763,582 Loans and bonds payable due within one year (note 9) 8,375,000 1,759,830 10,134,830 Loans and bonds payable due in more than one year (note 9) 155,497,382 26,314,702 181,812,084 Total liabilities 332,926,488 57,989,851 390,916,339 Net Assets Invested in capital assets, net <strong>of</strong> related debt 573,971,975 389,409,515 963,381,490 Restricted for (note 12): Housing and community development 73,976,356 — 73,976,356 Clean beaches and ocean parcel tax 2,536,009 — 2,536,009 Miscellaneous grants 18,512,612 — 18,512,612 Debt service 18,953,165 — 18,953,165 Development projects 38,400,473 — 38,400,473 Perpetual care - nonexpendable 7,726,238 — 7,726,238 Rail system — 1,625,057 1,625,057 MTBE Settlement 72,176,249 — 72,176,249 Unrestricted 209,438,522 104,955,422 314,393,944 Total net assets $ 1,015,691,599 495,989,994 1,511,681,593 See accompanying notes to basic financial statements. 15
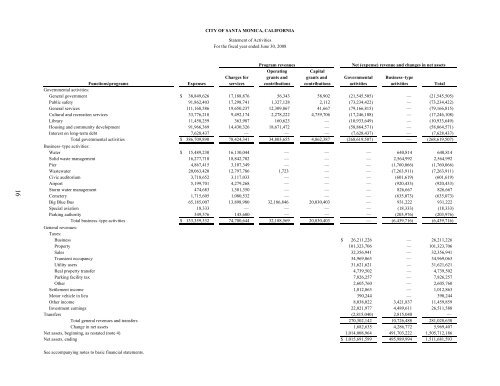
CITY OF SANTA MONICA, CALIFORNIA Statement <strong>of</strong> Activities For the fiscal year ended June 30, 2008 16 Program revenues Net (expense) revenue and changes in net assets Operating Capital Charges for grants and grants and Governmental Business–type Functions/programs Expenses services contributions contributions activities activities Total Governmental activities: General government $ 38,849,626 17,188,876 56,343 58,902 (21,545,505) — (21,545,505) Public safety 91,862,403 17,298,741 1,327,128 2,112 (73,234,422) — (73,234,422) General services 111,168,586 19,650,237 12,309,867 41,667 (79,166,815) — (79,166,815) Cultural and recreation services 33,776,210 9,492,174 2,278,222 4,759,706 (17,246,108) — (17,246,108) Library 11,458,259 363,987 160,623 — (10,933,649) — (10,933,649) Housing and community development 91,966,369 14,430,326 18,671,472 — (58,864,571) — (58,864,571) Interest on long-term debt 7,628,437 — — — (7,628,437) — (7,628,437) Total governmental activities $ 386,709,890 78,424,341 34,803,655 4,862,387 (268,619,507) — (268,619,507) Business–type activities: Water $ 15,489,230 16,130,044 — — — 640,814 640,814 Solid waste management 16,277,710 18,842,702 — — — 2,564,992 2,564,992 Pier 4,867,415 3,107,349 — — — (1,760,066) (1,760,066) Wastewater 20,063,420 12,797,786 1,723 — — (7,263,911) (7,263,911) Civic auditorium 3,718,652 3,117,033 — — — (601,619) (601,619) Airport 5,199,701 4,279,268 — — — (920,433) (920,433) Storm water management 474,683 1,301,350 — — — 826,667 826,667 Cemetery 1,715,605 1,080,532 — — — (635,073) (635,073) Big Blue Bus 65,185,007 13,898,980 32,186,846 20,030,403 — 931,222 931,222 Special aviation 18,333 — — — — (18,333) (18,333) Parking authority 349,576 145,600 — — — (203,976) (203,976) Total business–type activities $ 133,359,332 74,700,644 32,188,569 20,030,403 — (6,439,716) (6,439,716) General revenues: Taxes: Business $ 26,211,226 — 26,211,226 Property 101,323,706 — 101,323,706 Sales 32,356,941 — 32,356,941 Transient occupancy 34,969,063 — 34,969,063 Utility users 31,621,621 — 31,621,621 Real property transfer 4,739,502 — 4,739,502 Parking facility tax 7,826,257 — 7,826,257 Other 2,605,760 — 2,605,760 Settlement income 1,012,863 — 1,012,863 Motor vehicle in lieu 390,244 — 390,244 Other income 8,038,022 3,421,837 11,459,859 Investment earnings 22,021,977 4,489,611 26,511,588 Transfers (2,815,040) 2,815,040 — Total general revenues and transfers 270,302,142 10,726,488 281,028,630 Change in net assets 1,682,635 4,286,772 5,969,407 Net assets, beginning, as restated (note 4) 1,014,008,964 491,703,222 1,505,712,186 Net assets, ending $ 1,015,691,599 495,989,994 1,511,681,593 See accompanying notes to basic financial statements.
- Page 1 and 2: City of Santa Monica Comprehensive
- Page 3 and 4: City of Santa Monica, California Ye
- Page 5 and 6: CITY OF SANTA MONICA, CALIFORNIA Co
- Page 7: CITY OF SANTA MONICA, CALIFORNIA Co
- Page 10 and 11: Master Plan; (2) an ongoing commitm
- Page 12 and 13: needs of City infrastructure and fa
- Page 15 and 16: OFFICIALS OF THE CITY OF SANTA MONI
- Page 17 and 18: Certificate of Achievement for Exce
- Page 19 and 20: The Honorable Mayor and City Counci
- Page 21 and 22: CITY OF SANTA MONICA, CALIFORNIA Ma
- Page 23 and 24: CITY OF SANTA MONICA, CALIFORNIA Ma
- Page 25 and 26: CITY OF SANTA MONICA, CALIFORNIA Ma
- Page 27 and 28: CITY OF SANTA MONICA, CALIFORNIA Ma
- Page 29 and 30: CITY OF SANTA MONICA, CALIFORNIA Ma
- Page 31 and 32: CITY OF SANTA MONICA, CALIFORNIA Ma
- Page 33: City of Santa Monica, California Ye
- Page 37 and 38: CITY OF SANTA MONICA, CALIFORNIA Ba
- Page 39 and 40: CITY OF SANTA MONICA, CALIFORNIA Re
- Page 41 and 42: CITY OF SANTA MONICA, CALIFORNIA St
- Page 43 and 44: CITY OF SANTA MONICA, CALIFORNIA St
- Page 45 and 46: THIS PAGE INTENTIONALLY LEFT BLANK
- Page 47 and 48: CITY OF SANTA MONICA, CALIFORNIA St
- Page 49 and 50: CITY OF SANTA MONICA, CALIFORNIA St
- Page 51 and 52: CITY OF SANTA MONICA, CALIFORNIA St
- Page 53 and 54: CITY OF SANTA MONICA, CALIFORNIA St
- Page 55 and 56: CITY OF SANTA MONICA, CALIFORNIA No
- Page 57 and 58: CITY OF SANTA MONICA, CALIFORNIA No
- Page 59 and 60: CITY OF SANTA MONICA, CALIFORNIA No
- Page 61 and 62: CITY OF SANTA MONICA, CALIFORNIA No
- Page 63 and 64: CITY OF SANTA MONICA, CALIFORNIA No
- Page 65 and 66: CITY OF SANTA MONICA, CALIFORNIA No
- Page 67 and 68: CITY OF SANTA MONICA, CALIFORNIA No
- Page 69 and 70: CITY OF SANTA MONICA, CALIFORNIA No
- Page 71 and 72: CITY OF SANTA MONICA, CALIFORNIA No
- Page 73 and 74: CITY OF SANTA MONICA, CALIFORNIA No
- Page 75 and 76: CITY OF SANTA MONICA, CALIFORNIA No
- Page 77 and 78: CITY OF SANTA MONICA, CALIFORNIA No
- Page 79 and 80: CITY OF SANTA MONICA, CALIFORNIA No
- Page 81 and 82: CITY OF SANTA MONICA, CALIFORNIA No
- Page 83 and 84: CITY OF SANTA MONICA, CALIFORNIA No
- Page 85 and 86:
CITY OF SANTA MONICA, CALIFORNIA No
- Page 87 and 88:
CITY OF SANTA MONICA, CALIFORNIA No
- Page 89 and 90:
CITY OF SANTA MONICA, CALIFORNIA No
- Page 91 and 92:
CITY OF SANTA MONICA, CALIFORNIA No
- Page 93 and 94:
CITY OF SANTA MONICA, CALIFORNIA No
- Page 95 and 96:
CITY OF SANTA MONICA, CALIFORNIA No
- Page 97 and 98:
CITY OF SANTA MONICA, CALIFORNIA No
- Page 99 and 100:
CITY OF SANTA MONICA, CALIFORNIA No
- Page 101 and 102:
THIS PAGE INTENTIONALLY LEFT BLANK
- Page 103 and 104:
CITY OF SANTA MONICA, CALIFORNIA Re
- Page 106 and 107:
CITY OF SANTA MONICA, CALIFORNIA No
- Page 108 and 109:
THIS PAGE INTENTIONALLY LEFT BLANK
- Page 110 and 111:
CITY OF SANTA MONICA, CALIFORNIA Co
- Page 112 and 113:
Total nonmajor Citizens special Mis
- Page 114 and 115:
Total nonmajor Citizens special Mis
- Page 116 and 117:
CITY OF SANTA MONICA, CALIFORNIA Sc
- Page 118 and 119:
CITY OF SANTA MONICA, CALIFORNIA St
- Page 120 and 121:
CITY OF SANTA MONICA, CALIFORNIA Sc
- Page 122 and 123:
CITY OF SANTA MONICA, CALIFORNIA Sc
- Page 124 and 125:
CITY OF SANTA MONICA, CALIFORNIA Sc
- Page 126 and 127:
CITY OF SANTA MONICA, CALIFORNIA Sc
- Page 128 and 129:
CITY OF SANTA MONICA, CALIFORNIA Co
- Page 130 and 131:
CITY OF SANTA MONICA, CALIFORNIA Sc
- Page 132 and 133:
CITY OF SANTA MONICA, CALIFORNIA Sc
- Page 134 and 135:
THIS PAGE INTENTIONALLY LEFT BLANK
- Page 136 and 137:
CITY OF SANTA MONICA, CALIFORNIA Co
- Page 138 and 139:
CITY OF SANTA MONICA, CALIFORNIA Co
- Page 140 and 141:
CITY OF SANTA MONICA, CALIFORNIA No
- Page 142 and 143:
CITY OF SANTA MONICA, CALIFORNIA St
- Page 144 and 145:
CITY OF SANTA MONICA, CALIFORNIA St
- Page 146 and 147:
CITY OF SANTA MONICA, CALIFORNIA In
- Page 148 and 149:
CITY OF SANTA MONICA, CALIFORNIA St
- Page 150 and 151:
CITY OF SANTA MONICA, CALIFORNIA Fi
- Page 152 and 153:
CITY OF SANTA MONICA, CALIFORNIA Co
- Page 154 and 155:
City of Santa Monica, California Ye
- Page 156 and 157:
CITY OF SANTA MONICA, CALIFORNIA Fo
- Page 158 and 159:
CITY OF SANTA MONICA, CALIFORNIA Ch
- Page 160 and 161:
CITY OF SANTA MONICA, CALIFORNIA Fu
- Page 162 and 163:
CITY OF SANTA MONICA, CALIFORNIA Ch
- Page 164 and 165:
CITY OF SANTA MONICA, CALIFORNIA As
- Page 166 and 167:
CITY OF SANTA MONICA, CALIFORNIA Pr
- Page 168 and 169:
CITY OF SANTA MONICA, CALIFORNIA Ta
- Page 170 and 171:
CITY OF SANTA MONICA, CALIFORNIA Ra
- Page 172 and 173:
CITY OF SANTA MONICA, CALIFORNIA Co
- Page 174 and 175:
CITY OF SANTA MONICA, CALIFORNIA Re
- Page 176 and 177:
CITY OF SANTA MONICA, CALIFORNIA Re
- Page 178 and 179:
CITY OF SANTA MONICA, CALIFORNIA Pr
- Page 180 and 181:
CITY OF SANTA MONICA, CALIFORNIA Op
- Page 182:
THIS PAGE INTENTIONALLY LEFT BLANK