CITY OF SANTA MONICA, CALIFORNIA Statement <strong>of</strong> Revenues, Expenditures and Changes in Fund balance - Budget and Actual (Non-GAAP Basis) General Fund For the fiscal year ended June 30, 2008 23 Less Variance with 2006-2007 Plus Actual, final budget - Original Final encumbered 2007-2008 budgetary positive budget budget Actual expenditures encumbrances basis (negative) General services: Environmental and public works management Salaries $ 6,794,215 6,596,107 6,596,107 — — 6,596,107 — Supplies 1,797,708 1,993,938 1,904,456 23,312 112,794 1,993,938 — Capital outlay 13,200 7,974 17,561 11,153 1,566 7,974 — Total environmental and public works 8,605,123 8,598,019 8,518,124 34,465 114,360 8,598,019 — Community maintenance: Salaries 15,298,346 14,452,105 14,452,105 — — 14,452,105 — Supplies 9,612,323 10,337,313 10,300,668 37,129 73,774 10,337,313 — Capital outlay 53,800 89,633 89,633 — — 89,633 — Total community maintenance 24,964,469 24,879,051 24,842,406 37,129 73,774 24,879,051 — Capital limprovement 588,000 22,178,974 3,582,474 — 11,154,465154 465 14,736,939 7,442,035 Total general services 34,157,592 55,656,044 36,943,004 71,594 11,342,599 48,214,009 7,442,035 Cultural and recreation services: Community and cultural services Salaries 11,076,412 11,755,380 11,755,380 — — 11,755,380 — Supplies 19,089,209 19,096,854 17,954,058 444,062 1,586,858 19,096,854 — Capital outlay 20,000 9,442 9,941 9,893 9,394 9,442 — Total community and cultural services 30,185,621 30,861,676 29,719,379 453,955 1,596,252 30,861,676 — Capital improvement 192,000 10,692,712 2,597,474 — 1,598,080 4,195,554 6,497,158 Total cultural and recreation services 30,377,621 41,554,388 32,316,853 453,955 3,194,332 35,057,230 6,497,158 Library: Salaries 7,636,207 7,656,352 7,656,352 — — 7,656,352 — Supplies 2,556,750 2,512,984 2,519,033 308,188 302,139 2,512,984 — 10,192,957 10,169,336 10,175,385 308,188 302,139 10,169,336 — Capital improvement — 44,545 44,545 — — 44,545 — Total library 10,192,957 10,213,881 10,219,930 308,188 302,139 10,213,881 — (Continued)
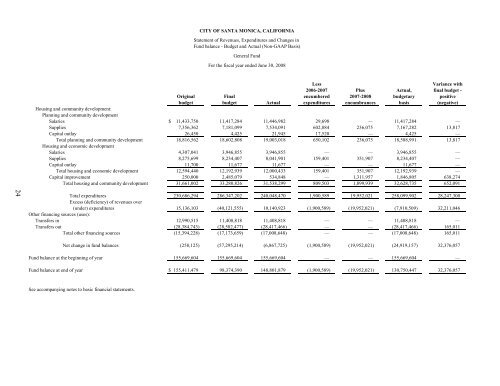
CITY OF SANTA MONICA, CALIFORNIA Statement <strong>of</strong> Revenues, Expenditures and Changes in Fund balance - Budget and Actual (Non-GAAP Basis) General Fund For the fiscal year ended June 30, 2008 Less Variance with 2006-2007 Plus Actual, final budget - Original Final encumbered 2007-2008 budgetary positive budget budget Actual expenditures encumbrances basis (negative) Housing and community development: Planning and community development Salaries $ 11,433,750 11,417,284 11,446,982 29,698 — 11,417,284 — Supplies 7,356,362 7,181,099 7,534,091 602,884 236,075 7,167,282 13,817 Capital outlay 26,450 4,425 21,945 17,520 — 4,425 — Total planning and community development 18,816,562 18,602,808 19,003,018 650,102 236,075 18,588,991 13,817 Housing and economic development Salaries 4,307,041 3,946,855 3,946,855 — — 3,946,855 — Supplies 8,275,699 8,234,407 8,041,901 159,401 351,907 8,234,407 — Capital outlay 11,700 11,677 11,677 — — 11,677 — Total housing and economic development 12,594,440 12,192,939 12,000,433 159,401 351,907 12,192,939 — Capital improvement 250,000 2,485,079 534,848 — 1,311,957 1,846,805 638,274 Total housing and community development 31,661,002 33,280,826 31,538,299 809,503 1,899,939 32,628,735 652,091 24 Total expenditures 230,686,294 286,347,202 240,048,470 1,900,589 19,952,021 258,099,902 28,247,300 Excess (deficiency) <strong>of</strong> revenues over (under) expenditures 15,136,103 (40,121,555) 10,140,923 (1,900,589) (19,952,021) (7,910,509) 32,211,046 Other financing sources (uses): Transfers in 12,990,515 11,408,818 11,408,818 — — 11,408,818 — Transfers out (28,384,743) (28,582,477) (28,417,466) — — (28,417,466) 165,011 Total other financing sources (15,394,228) (17,173,659) (17,008,648) — — (17,008,648) 165,011 Net change in fund balances (258,125) (57,295,214) (6,867,725) (1,900,589) (19,952,021) (24,919,157) 32,376,057 Fund balance at the beginning <strong>of</strong> year 155,669,604 155,669,604 155,669,604 — — 155,669,604 — Fund balance at end <strong>of</strong> year $ 155,411,479 98,374,390 148,801,879 (1,900,589) (19,952,021) 130,750,447 32,376,057 See accompanying notes to basic financial statements.
- Page 1 and 2: City of Santa Monica Comprehensive
- Page 3 and 4: City of Santa Monica, California Ye
- Page 5 and 6: CITY OF SANTA MONICA, CALIFORNIA Co
- Page 7: CITY OF SANTA MONICA, CALIFORNIA Co
- Page 10 and 11: Master Plan; (2) an ongoing commitm
- Page 12 and 13: needs of City infrastructure and fa
- Page 15 and 16: OFFICIALS OF THE CITY OF SANTA MONI
- Page 17 and 18: Certificate of Achievement for Exce
- Page 19 and 20: The Honorable Mayor and City Counci
- Page 21 and 22: CITY OF SANTA MONICA, CALIFORNIA Ma
- Page 23 and 24: CITY OF SANTA MONICA, CALIFORNIA Ma
- Page 25 and 26: CITY OF SANTA MONICA, CALIFORNIA Ma
- Page 27 and 28: CITY OF SANTA MONICA, CALIFORNIA Ma
- Page 29 and 30: CITY OF SANTA MONICA, CALIFORNIA Ma
- Page 31 and 32: CITY OF SANTA MONICA, CALIFORNIA Ma
- Page 33 and 34: City of Santa Monica, California Ye
- Page 35 and 36: CITY OF SANTA MONICA, CALIFORNIA St
- Page 37 and 38: CITY OF SANTA MONICA, CALIFORNIA Ba
- Page 39 and 40: CITY OF SANTA MONICA, CALIFORNIA Re
- Page 41: CITY OF SANTA MONICA, CALIFORNIA St
- Page 45 and 46: THIS PAGE INTENTIONALLY LEFT BLANK
- Page 47 and 48: CITY OF SANTA MONICA, CALIFORNIA St
- Page 49 and 50: CITY OF SANTA MONICA, CALIFORNIA St
- Page 51 and 52: CITY OF SANTA MONICA, CALIFORNIA St
- Page 53 and 54: CITY OF SANTA MONICA, CALIFORNIA St
- Page 55 and 56: CITY OF SANTA MONICA, CALIFORNIA No
- Page 57 and 58: CITY OF SANTA MONICA, CALIFORNIA No
- Page 59 and 60: CITY OF SANTA MONICA, CALIFORNIA No
- Page 61 and 62: CITY OF SANTA MONICA, CALIFORNIA No
- Page 63 and 64: CITY OF SANTA MONICA, CALIFORNIA No
- Page 65 and 66: CITY OF SANTA MONICA, CALIFORNIA No
- Page 67 and 68: CITY OF SANTA MONICA, CALIFORNIA No
- Page 69 and 70: CITY OF SANTA MONICA, CALIFORNIA No
- Page 71 and 72: CITY OF SANTA MONICA, CALIFORNIA No
- Page 73 and 74: CITY OF SANTA MONICA, CALIFORNIA No
- Page 75 and 76: CITY OF SANTA MONICA, CALIFORNIA No
- Page 77 and 78: CITY OF SANTA MONICA, CALIFORNIA No
- Page 79 and 80: CITY OF SANTA MONICA, CALIFORNIA No
- Page 81 and 82: CITY OF SANTA MONICA, CALIFORNIA No
- Page 83 and 84: CITY OF SANTA MONICA, CALIFORNIA No
- Page 85 and 86: CITY OF SANTA MONICA, CALIFORNIA No
- Page 87 and 88: CITY OF SANTA MONICA, CALIFORNIA No
- Page 89 and 90: CITY OF SANTA MONICA, CALIFORNIA No
- Page 91 and 92: CITY OF SANTA MONICA, CALIFORNIA No
- Page 93 and 94:
CITY OF SANTA MONICA, CALIFORNIA No
- Page 95 and 96:
CITY OF SANTA MONICA, CALIFORNIA No
- Page 97 and 98:
CITY OF SANTA MONICA, CALIFORNIA No
- Page 99 and 100:
CITY OF SANTA MONICA, CALIFORNIA No
- Page 101 and 102:
THIS PAGE INTENTIONALLY LEFT BLANK
- Page 103 and 104:
CITY OF SANTA MONICA, CALIFORNIA Re
- Page 106 and 107:
CITY OF SANTA MONICA, CALIFORNIA No
- Page 108 and 109:
THIS PAGE INTENTIONALLY LEFT BLANK
- Page 110 and 111:
CITY OF SANTA MONICA, CALIFORNIA Co
- Page 112 and 113:
Total nonmajor Citizens special Mis
- Page 114 and 115:
Total nonmajor Citizens special Mis
- Page 116 and 117:
CITY OF SANTA MONICA, CALIFORNIA Sc
- Page 118 and 119:
CITY OF SANTA MONICA, CALIFORNIA St
- Page 120 and 121:
CITY OF SANTA MONICA, CALIFORNIA Sc
- Page 122 and 123:
CITY OF SANTA MONICA, CALIFORNIA Sc
- Page 124 and 125:
CITY OF SANTA MONICA, CALIFORNIA Sc
- Page 126 and 127:
CITY OF SANTA MONICA, CALIFORNIA Sc
- Page 128 and 129:
CITY OF SANTA MONICA, CALIFORNIA Co
- Page 130 and 131:
CITY OF SANTA MONICA, CALIFORNIA Sc
- Page 132 and 133:
CITY OF SANTA MONICA, CALIFORNIA Sc
- Page 134 and 135:
THIS PAGE INTENTIONALLY LEFT BLANK
- Page 136 and 137:
CITY OF SANTA MONICA, CALIFORNIA Co
- Page 138 and 139:
CITY OF SANTA MONICA, CALIFORNIA Co
- Page 140 and 141:
CITY OF SANTA MONICA, CALIFORNIA No
- Page 142 and 143:
CITY OF SANTA MONICA, CALIFORNIA St
- Page 144 and 145:
CITY OF SANTA MONICA, CALIFORNIA St
- Page 146 and 147:
CITY OF SANTA MONICA, CALIFORNIA In
- Page 148 and 149:
CITY OF SANTA MONICA, CALIFORNIA St
- Page 150 and 151:
CITY OF SANTA MONICA, CALIFORNIA Fi
- Page 152 and 153:
CITY OF SANTA MONICA, CALIFORNIA Co
- Page 154 and 155:
City of Santa Monica, California Ye
- Page 156 and 157:
CITY OF SANTA MONICA, CALIFORNIA Fo
- Page 158 and 159:
CITY OF SANTA MONICA, CALIFORNIA Ch
- Page 160 and 161:
CITY OF SANTA MONICA, CALIFORNIA Fu
- Page 162 and 163:
CITY OF SANTA MONICA, CALIFORNIA Ch
- Page 164 and 165:
CITY OF SANTA MONICA, CALIFORNIA As
- Page 166 and 167:
CITY OF SANTA MONICA, CALIFORNIA Pr
- Page 168 and 169:
CITY OF SANTA MONICA, CALIFORNIA Ta
- Page 170 and 171:
CITY OF SANTA MONICA, CALIFORNIA Ra
- Page 172 and 173:
CITY OF SANTA MONICA, CALIFORNIA Co
- Page 174 and 175:
CITY OF SANTA MONICA, CALIFORNIA Re
- Page 176 and 177:
CITY OF SANTA MONICA, CALIFORNIA Re
- Page 178 and 179:
CITY OF SANTA MONICA, CALIFORNIA Pr
- Page 180 and 181:
CITY OF SANTA MONICA, CALIFORNIA Op
- Page 182:
THIS PAGE INTENTIONALLY LEFT BLANK