

Comprehensive Annual Financial Report - City of Santa Monica
Comprehensive Annual Financial Report - City of Santa Monica
Comprehensive Annual Financial Report - City of Santa Monica

Create successful ePaper yourself
Turn your PDF publications into a flip-book with our unique Google optimized e-Paper software.
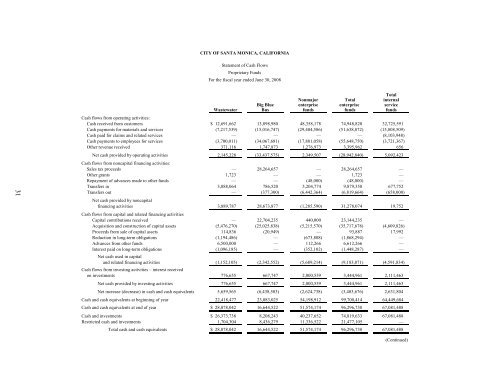
CITY OF SANTA MONICA, CALIFORNIA<br />
Statement <strong>of</strong> Cash Flows<br />
Proprietary Funds<br />
For the fiscal year ended June 30, 2008<br />
31<br />
Total<br />
Nonmajor Total internal<br />
Big Blue enterprise enterprise service<br />
Wastewater Bus funds funds funds<br />
Cash flows from operating activities:<br />
Cash received from customers $ 12,691,662 13,898,980 48,358,178 74,948,820 32,725,591<br />
Cash payments for materials and services (7,217,539) (15,016,747) (29,404,586) (51,638,872) (15,808,509)<br />
Cash paid for claims and related services — — — — (8,103,948)<br />
Cash payments to employees for services (3,700,011) (34,067,681) (17,881,058) (55,648,750) (3,721,367)<br />
Other revenue received 371,116 1,747,873 1,276,973 3,395,962 656<br />
Net cash provided by operating activities 2,145,228 (33,437,575) 2,349,507 (28,942,840) 5,092,423<br />
Cash flows from noncapital financing activities:<br />
Sales tax proceeds — 28,264,657 — 28,264,657 —<br />
Other grants 1,723 — — 1,723 —<br />
Repayment <strong>of</strong> advances made to other funds — — (48,000) (48,000) —<br />
Transfers in 3,888,064 786,520 5,204,774 9,879,358 677,752<br />
Transfers out — (377,300) (6,442,364) (6,819,664) (658,000)<br />
Net cash provided by noncapital<br />
financing activities 3,889,787 28,673,877 (1,285,590) 31,278,074 19,752<br />
Cash flows from capital and related financing activities<br />
Capital contributions received — 22,704,235 440,000 23,144,235 —<br />
Acquisition and construction <strong>of</strong> capital assets (5,476,270) (25,025,838) (5,215,570) (35,717,678) (4,609,826)<br />
Proceeds from sale <strong>of</strong> capital assets 114,836 (20,949) — 93,887 17,992<br />
Reduction in long-term obligations (1,194,486) — (673,808) (1,868,294) —<br />
Advances from other funds 6,500,000 — 112,266 6,612,266 —<br />
Interest paid on long-term obligations (1,096,185) — (352,102) (1,448,287) —<br />
Net cash used in capital<br />
and related financing activities (1,152,105) (2,342,552) (5,689,214) (9,183,871) (4,591,834)<br />
Cash flows from investing activities – interest received<br />
on investments 776,655 667,747 2,000,559 3,444,961 2,111,463<br />
Net cash provided by investing activities 776,655 667,747 2,000,559 3,444,961 2,111,463<br />
Net increase (decrease) in cash and cash equivalents 5,659,565 (6,438,503) (2,624,738) (3,403,676) 2,631,804<br />
Cash and cash equivalents at beginning <strong>of</strong> year 22,418,477 23,083,025 54,198,912 99,700,414 64,449,684<br />
Cash and cash equivalents at end <strong>of</strong> year $ 28,078,042 16,644,522 51,574,174 96,296,738 67,081,488<br />
Cash and investments $ 26,373,738<br />
8,208,243 40,237,652 74,819,633 67,081,488<br />
Restricted cash and investments 1,704,304 8,436,279 11,336,522 21,477,105 —<br />
Total cash and cash equivalents $ 28,078,042 16,644,522 51,574,174 96,296,738 67,081,488<br />
(Continued)


