

Comprehensive Annual Financial Report - City of Santa Monica
Comprehensive Annual Financial Report - City of Santa Monica
Comprehensive Annual Financial Report - City of Santa Monica

Create successful ePaper yourself
Turn your PDF publications into a flip-book with our unique Google optimized e-Paper software.
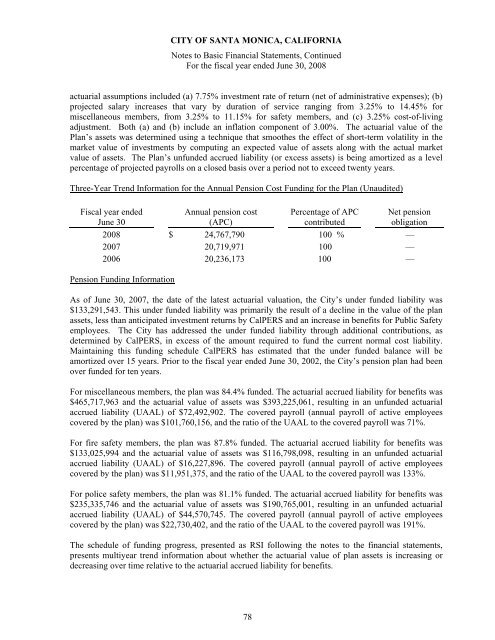
CITY OF SANTA MONICA, CALIFORNIA<br />
Notes to Basic <strong>Financial</strong> Statements, Continued<br />
For the fiscal year ended June 30, 2008<br />
actuarial assumptions included (a) 7.75% investment rate <strong>of</strong> return (net <strong>of</strong> administrative expenses); (b)<br />
projected salary increases that vary by duration <strong>of</strong> service ranging from 3.25% to 14.45% for<br />
miscellaneous members, from 3.25% to 11.15% for safety members, and (c) 3.25% cost-<strong>of</strong>-living<br />
adjustment. Both (a) and (b) include an inflation component <strong>of</strong> 3.00%. The actuarial value <strong>of</strong> the<br />
Plan’s assets was determined using a technique that smoothes the effect <strong>of</strong> short-term volatility in the<br />
market value <strong>of</strong> investments by computing an expected value <strong>of</strong> assets along with the actual market<br />
value <strong>of</strong> assets. The Plan’s unfunded accrued liability (or excess assets) is being amortized as a level<br />
percentage <strong>of</strong> projected payrolls on a closed basis over a period not to exceed twenty years.<br />
Three-Year Trend Information for the <strong>Annual</strong> Pension Cost Funding for the Plan (Unaudited)<br />
Fiscal year ended<br />
June 30<br />
<strong>Annual</strong> pension cost<br />
(APC)<br />
Percentage <strong>of</strong> APC<br />
contributed<br />
Net pension<br />
obligation<br />
2008 $ 24,767,790 100 % —<br />
2007 20,719,971 100 —<br />
2006 20,236,173 100 —<br />
Pension Funding Information<br />
As <strong>of</strong> June 30, 2007, the date <strong>of</strong> the latest actuarial valuation, the <strong>City</strong>’s under funded liability was<br />
$133,291,543. This under funded liability was primarily the result <strong>of</strong> a decline in the value <strong>of</strong> the plan<br />
assets, less than anticipated investment returns by CalPERS and an increase in benefits for Public Safety<br />
employees. The <strong>City</strong> has addressed the under funded liability through additional contributions, as<br />
determined by CalPERS, in excess <strong>of</strong> the amount required to fund the current normal cost liability.<br />
Maintaining this funding schedule CalPERS has estimated that the under funded balance will be<br />
amortized over 15 years. Prior to the fiscal year ended June 30, 2002, the <strong>City</strong>’s pension plan had been<br />
over funded for ten years.<br />
For miscellaneous members, the plan was 84.4% funded. The actuarial accrued liability for benefits was<br />
$465,717,963 and the actuarial value <strong>of</strong> assets was $393,225,061, resulting in an unfunded actuarial<br />
accrued liability (UAAL) <strong>of</strong> $72,492,902. The covered payroll (annual payroll <strong>of</strong> active employees<br />
covered by the plan) was $101,760,156, and the ratio <strong>of</strong> the UAAL to the covered payroll was 71%.<br />
For fire safety members, the plan was 87.8% funded. The actuarial accrued liability for benefits was<br />
$133,025,994 and the actuarial value <strong>of</strong> assets was $116,798,098, resulting in an unfunded actuarial<br />
accrued liability (UAAL) <strong>of</strong> $16,227,896. The covered payroll (annual payroll <strong>of</strong> active employees<br />
covered by the plan) was $11,951,375, and the ratio <strong>of</strong> the UAAL to the covered payroll was 133%.<br />
For police safety members, the plan was 81.1% funded. The actuarial accrued liability for benefits was<br />
$235,335,746 and the actuarial value <strong>of</strong> assets was $190,765,001, resulting in an unfunded actuarial<br />
accrued liability (UAAL) <strong>of</strong> $44,570,745. The covered payroll (annual payroll <strong>of</strong> active employees<br />
covered by the plan) was $22,730,402, and the ratio <strong>of</strong> the UAAL to the covered payroll was 191%.<br />
The schedule <strong>of</strong> funding progress, presented as RSI following the notes to the financial statements,<br />
presents multiyear trend information about whether the actuarial value <strong>of</strong> plan assets is increasing or<br />
decreasing over time relative to the actuarial accrued liability for benefits.<br />
78


