

Comprehensive Annual Financial Report - City of Santa Monica
Comprehensive Annual Financial Report - City of Santa Monica
Comprehensive Annual Financial Report - City of Santa Monica

Create successful ePaper yourself
Turn your PDF publications into a flip-book with our unique Google optimized e-Paper software.
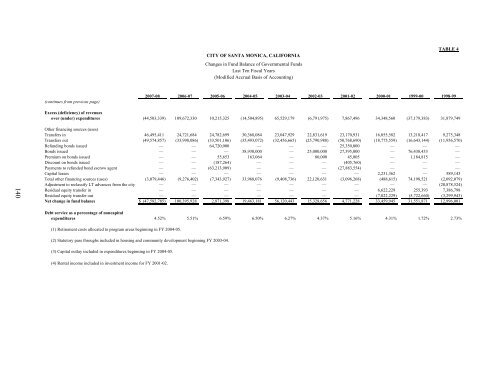
CITY OF SANTA MONICA, CALIFORNIA<br />
Changes in Fund Balance <strong>of</strong> Governmental Funds<br />
Last Ten Fiscal Years<br />
(Modified Accrual Basis <strong>of</strong> Accounting)<br />
TABLE 4<br />
(continues from previous page)<br />
2007-08 2006-07 2005-06 2004-05 2003-04 2002-03 2001-02 2000-01 1999-00 1998-99<br />
Excess (deficiency) <strong>of</strong> revenues<br />
over (under) expenditures (44,503,339) 109,672,330 10,215,325 (14,504,895) 65,529,179 (6,791,975) 7,867,496 34,348,560 (37,179,383) 31,879,749<br />
140<br />
Other financing sources (uses)<br />
Transfers in 46,495,411 24,721,684 24,782,699 30,368,084 23,047,929 22,831,619 23,170,931 16,055,582 13,218,417 9,275,348<br />
Transfers out (49,574,857) (33,998,086) (33,501,106) (35,493,072) (32,456,665) (25,790,988) (50,768,690) (18,775,559) (16,643,144) (11,956,570)<br />
Refunding bonds issued — — 64,720,000 — — — 25,350,000 — — —<br />
Bonds issued — — — 38,930,000 — 25,000,000 27,395,000 — 76,438,433 —<br />
Premium on bonds issued — — 55,653 163,064 — 80,000 45,805 — 1,184,815 —<br />
Discount on bonds issued — — (187,264) — — — (405,760) — — —<br />
Payments to refunded bond escrow agent — — (63,213,909) — — — (27,883,554) — — —<br />
Capital leases — — — — — — — 2,231,362 — 589,143<br />
Total other financing sources (uses) (3,079,446) (9,276,402) (7,343,927) 33,968,076 (9,408,736) 22,120,631 (3,096,268) (488,615) 74,198,521 (2,092,079)<br />
Adjustment to reclassify LT advances from the city — — — — — — — — — (20,878,524)<br />
Residual equity transfer in — — — — — — — 6,622,229 255,393 7,386,798<br />
Residual equity transfer out — — — — — — — (7,022,229) (5,722,660) (3,299,943)<br />
Net change in fund balance $ (47,582,785) 100,395,928 2,871,398 19,463,181 56,120,443 15,328,656 4,771,228 33,459,945 31,551,871 12,996,001<br />
Debt service as a percentage <strong>of</strong> noncapital<br />
expenditures 4.52% 5.51% 6.59% 6.50% 6.27% 4.37% 5.16% 4.31% 1.72% 2.73%<br />
(1) Retirement costs allocated to program areas beginning in FY 2004-05.<br />
(2) Statutory pass throughs included in housing and community development beginning FY 2003-04.<br />
(3) Capital outlay included in expenditures beginning in FY 2004-05.<br />
(4) Rental income included in investment income for FY 2001-02.


