

Comprehensive Annual Financial Report - City of Santa Monica
Comprehensive Annual Financial Report - City of Santa Monica
Comprehensive Annual Financial Report - City of Santa Monica

You also want an ePaper? Increase the reach of your titles
YUMPU automatically turns print PDFs into web optimized ePapers that Google loves.
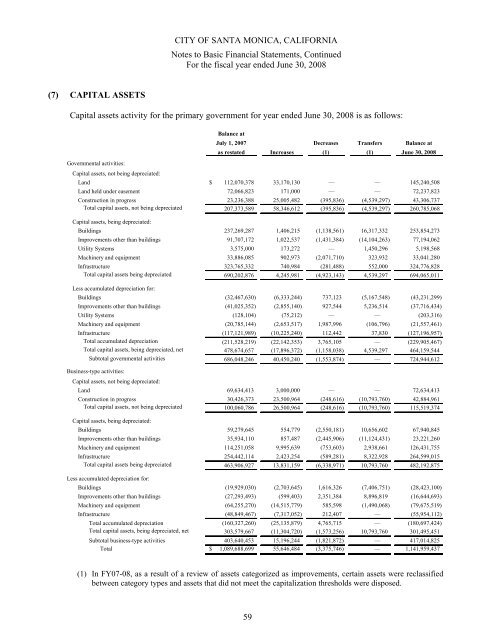
CITY OF SANTA MONICA, CALIFORNIA<br />
Notes to Basic <strong>Financial</strong> Statements, Continued<br />
For the fiscal year ended June 30, 2008<br />
(7) CAPITAL ASSETS<br />
Capital assets activity for the primary government for year ended June 30, 2008 is as follows:<br />
Balance at<br />
July 1, 2007<br />
as restated<br />
Increases<br />
Decreases<br />
(1)<br />
Transfers<br />
(1)<br />
Balance at<br />
June 30, 2008<br />
Governmental activities:<br />
Capital assets, not being depreciated:<br />
Land $ 112,070,378 33,170,130 — — 145,240,508<br />
Land held under easement 72,066,823 171,000 — — 72,237,823<br />
Construction in progress 23,236,388 25,005,482 (395,836) (4,539,297) 43,306,737<br />
Total capital assets, not being depreciated 207,373,589 58,346,612 (395,836) (4,539,297) 260,785,068<br />
Capital assets, being depreciated:<br />
Buildings 237,269,287 1,406,215 (1,138,561) 16,317,332 253,854,273<br />
Improvements other than buildings 91,707,172 1,022,537 (1,431,384) (14,104,263) 77,194,062<br />
Utility Systems 3,575,000 173,272 — 1,450,296 5,198,568<br />
Machinery and equipment 33,886,085 902,973 (2,071,710) 323,932 33,041,280<br />
Infrastructure 323,765,332 740,984 (281,488) 552,000 324,776,828<br />
Total capital assets being depreciated 690,202,876 4,245,981 (4,923,143) 4,539,297 694,065,011<br />
Less accumulated depreciation for:<br />
Buildings (32,467,630) (6,333,244) 737,123 (5,167,548) (43,231,299)<br />
Improvements other than buildings (41,025,352) (2,855,140) 927,544 5,236,514 (37,716,434)<br />
Utility Systems (128,104) (75,212) — — (203,316)<br />
Machinery and equipment (20,785,144) (2,653,517) 1,987,996 (106,796) (21,557,461)<br />
Infrastructure (117,121,989) (10,225,240) 112,442 37,830 (127,196,957)<br />
Total accumulated depreciation (211,528,219) (22,142,353) 3,765,105 — (229,905,467)<br />
Total capital assets, being depreciated, net 478,674,657 (17,896,372) (1,158,038) 4,539,297 464,159,544<br />
Subtotal governmental activities 686,048,246 40,450,240 (1,553,874) — 724,944,612<br />
Business-type activities:<br />
Capital assets, not being depreciated:<br />
Land 69,634,413 3,000,000 — — 72,634,413<br />
Construction in progress 30,426,373 23,500,964 (248,616) (10,793,760) 42,884,961<br />
Total capital assets, not being depreciated 100,060,786 26,500,964 (248,616) (10,793,760) 115,519,374<br />
Capital assets, being depreciated:<br />
Buildings 59,279,645 554,779 (2,550,181) 10,656,602 67,940,845<br />
Improvements other than buildings 35,934,110 857,487 (2,445,906) (11,124,431) 23,221,260<br />
Machinery and equipment 114,251,058 9,995,639 (753,603) 2,938,661 126,431,755<br />
Infrastructure 254,442,114 2,423,254 (589,281) 8,322,928 264,599,015<br />
Total capital assets being depreciated 463,906,927 13,831,159 (6,338,971) 10,793,760 482,192,875<br />
Less accumulated depreciation for:<br />
Buildings (19,929,030) (2,703,645) 1,616,326 (7,406,751) (28,423,100)<br />
Improvements other than buildings (27,293,493) (599,403) 2,351,384 8,896,819 (16,644,693)<br />
Machinery and equipment (64,255,270) (14,515,779) 585,598 (1,490,068) (79,675,519)<br />
Infrastructure (48,849,467) (7,317,052) 212,407 — (55,954,112)<br />
Total accumulated depreciation (160,327,260) (25,135,879) 4,765,715 — (180,697,424)<br />
Total capital assets, being depreciated, net 303,579,667 (11,304,720) (1,573,256) 10,793,760 301,495,451<br />
Subtotal business-type activities 403,640,453 15,196,244 (1,821,872) — 417,014,825<br />
Total $ 1,089,688,699 55,646,484 (3,375,746) — 1,141,959,437<br />
(1) In FY07-08, as a result <strong>of</strong> a review <strong>of</strong> assets categorized as improvements, certain assets were reclassified<br />
between category types and assets that did not meet the capitalization thresholds were disposed.<br />
59


